Note: Behavioral Risks (Red-Teaming) are only available with Mend AI Premium.
Contact your Customer Success Manager at Mend.io for more details about Mend AI Premium.
Overview
Once you start your first probes, the Overview page will begin populating with data. The dashboard provides a quick view of your target's metrics, delivering real-time insights into recent probe runs and their outcomes.
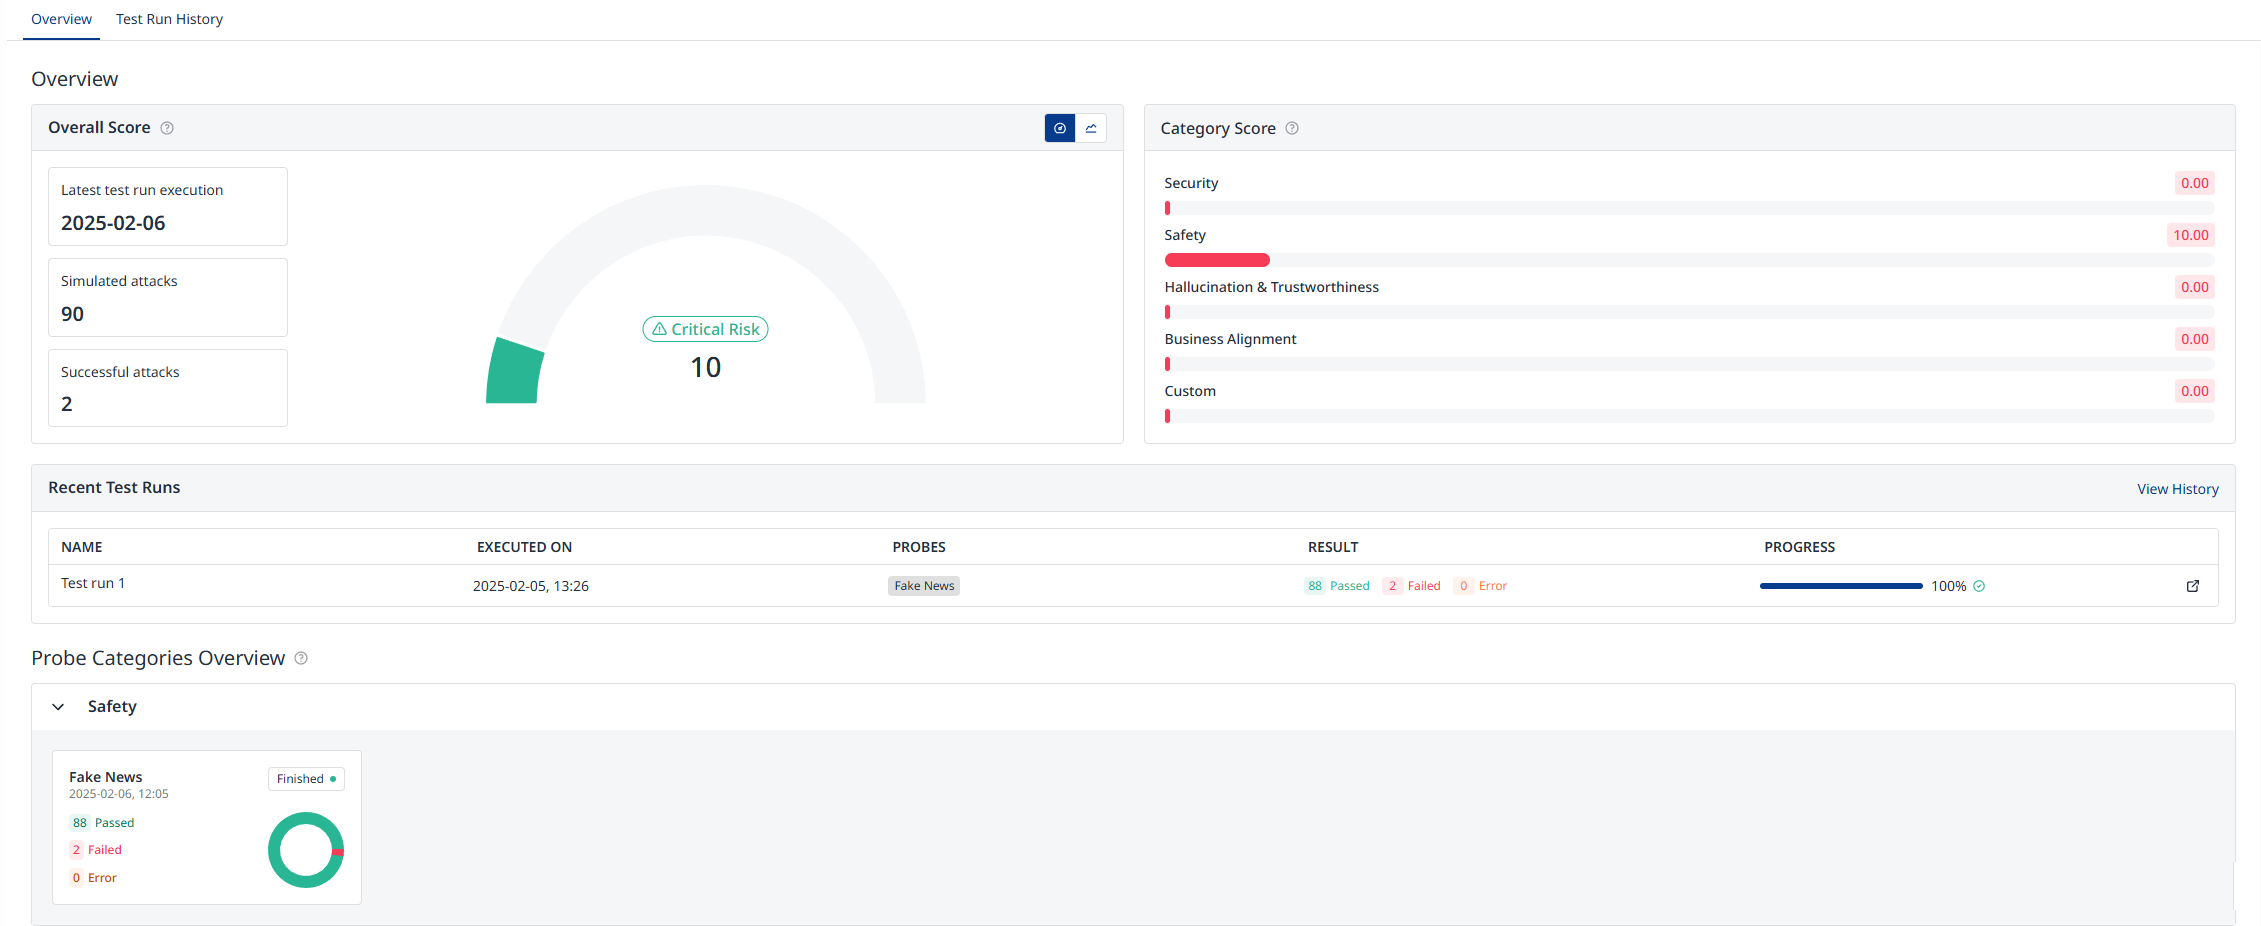
Overall Score
In the top left corner of the overview, the Target Overall Score is displayed. The overall score is a combination of individual category scores, giving you one number that summarizes the performance of your target application. It shows the total number of simulated attacks and successful attacks across different probe categories. The results are taken from the latest available probe runs of each probe. A higher score is preferable.
The Overall Score ranges 0–100, where lower numbers mean higher risk. We group the score into four risk bands:
-
🔴 CRITICAL: < 30 Severe risk. Immediate action required.
-
🟠 HIGH: 30–59.9 Elevated risk. Prioritize mitigation.
-
🟡 MEDIUM: 60–79.9 Moderate risk. Monitor closely and address issues.
-
🟢 LOW: ≥ 80 Low risk. Routine monitoring and improvements.
Toggling the chart switches it to a time series view, allowing you to track your application's overall score over time.
Category Scores
In the Category Scores section, you can view detailed scores for each key evaluation area assessed by the probes. These categories include: Security, Safety, Hallucination & Trustworthiness, and Business Alignment. Each score reflects the performance of your target application in that specific area, based on the latest available probe runs.
Similar to the overall score, each category score is calculated based on the number of failed test cases, their severity, and their expected probability, taking into account the risk priority set for each probe within that category, which can be customized by the user. Higher scores indicate better performance.
Recent Test Runs
The overview of the latest test runs performed on the target is listed here, with the most recent run displayed at the top. Clicking on a test run will open the Test Run View.
Categories Overview
In this section, probes are organized by category, displaying results from their most recent execution. Each probe card provides the probe’s name, the date and time of the last run, and a summary of the results. Selecting a probe card will open the corresponding Probe Run View.