Reports in the Mend AppSec Platform
Overview
Mend’s reporting capability allows you to generate detailed insights across your projects, covering open-source dependencies, code vulnerabilities, and container images. With various report types tailored to specific needs, you can easily assess security, compliance, and risk, while managing and downloading reports directly from the Reports page. This article will walk you through creating and managing reports in the Mend Platform.
Use case for each Report Type
When creating a report, you can choose from three Scan Engines, each offering a range of specific report types designed to meet various analysis needs:
Mend AI
AI Inventory: Provides a comprehensive inventory of all discovered AI models in your organization.
AI Models Security Findings: Shows security findings and vulnerabilities for your AI components and models.
Mend Dependencies (SCA)
Dependencies SBOM: Details the libraries, code packages, and third-party components in your application.
Dependencies Risk: Highlights critical security and maintenance insights for your project’s open-source libraries.
Dependencies Due Diligence: Provides a comprehensive view of open-source libraries across selected projects, including risk scores and licenses.
Dependencies Inventory: Offers a detailed breakdown of library functions, assigned licenses, and usage within the project scope.
Dependencies Attribution: Delivers compliance information on third-party components managed in your application or project.
Dependencies Findings: Summarize the vulnerabilities found in the open-source libraries used in your project.
Mend Code (SAST)
Code Findings: Provides detailed insights into your application's or project's code findings.
Code Compliance: Ensures your code aligns with top industry standards.
Code Suppressions: Provides a clear overview of suppressed vulnerabilities in your Project/Application.
Mend Container
Container Image Attribution: Details the open-source packages used in your container images.
Container Image Due Diligence: Assesses the security and compliance status of software components within your container images.
Container Image SBOM: Provides a clear view of the components within your container images.
Getting it done
Click the Reports button at the top menu bar to access the Reports dashboard:

The Reports table lists the reports that have been generated within your organization:

Table Columns

Column Value | Definition | |
|---|---|---|
1 | Report Name | The name of the report. The default naming convention is: Scan Engine + Report Name Example 1: AI Inventory Report This name indicates that it’s a Mend AI report Example 1: Dependencies Due Diligence Report This name indicates that it’s an SCA report Example 2: Code Findings Report This name indicates that it’s a SAST report Example 3: Container Image Due Diligence Report This name indicates that it’s a Container report |
2 | Report Type | The type of report that was created. The available options are: |
3 | Status | The current status of the report. The available options are:
|
4 | Scope | The scope of the report. The available options are:
|
5 | Scope Name | The name of the selected scope. For example, if my report is an application-level report and the application for which the report was generated is named 'test', the Scope Name will be ‘test’. |
6 | Format | The generated report’s file format. Depending on the Report Type, The available options are:
|
7 | Generated By | The email address of the user that generated the report |
8 | Date | The date and time the report was created |
9 | Actions | Actions that can be executed on the report. The current options are:
|
Adjust the Reports Table
Adding/Removing and Reordering Columns
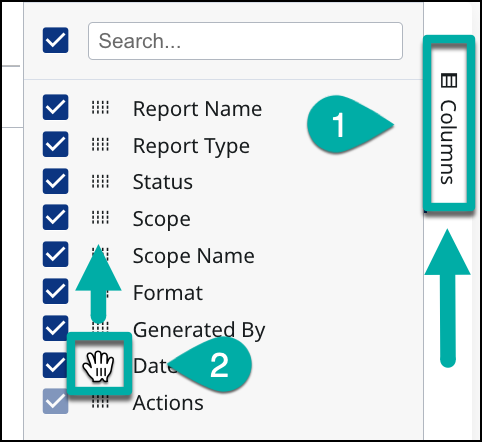
Columns can be added or removed from the reports table by clicking the ‘Columns’ button at the right edge of the UI and checking/unchecking the boxes next to the desired column names.
Here you can also reorder the columns in the table by dragging the 12-dot icon ![]() next to the desired column name to its desired new location.
next to the desired column name to its desired new location.

Note that the Actions column cannot be removed and is therefore grayed out.
Similarly, you can also reorder the columns in the table itself by dragging the column header sideways:

Searching & Filtering Reports
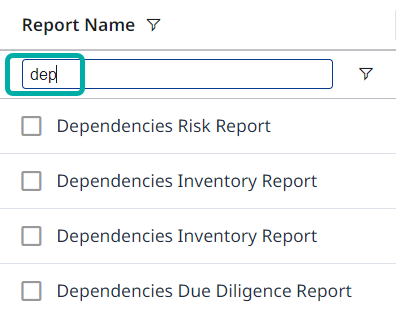
All the columns bar the Actions column contain a filter option (![]() ). The columns that don’t have a predefined list of values in the filter are searchable by text. Searching through reports by text is done by entering the search query into the relevant column’s search box.
). The columns that don’t have a predefined list of values in the filter are searchable by text. Searching through reports by text is done by entering the search query into the relevant column’s search box.
Example:

Entering the string ‘dep’ in the Report Name search box will return all previously generated reports with the string ‘dep’ in their name. This can be used, for instance, to list the Dependencies reports.
Filtering by Label
By extension, you can use labels to create and filter reports in the Mend AppSec Platform.
You will get a list of existing labels to select, with the ability to select up to 10 labels for your report.
You can use labels that are assigned to both applications and projects.
Filtering by Scan Engine (AI/SCA/SAST/Container)
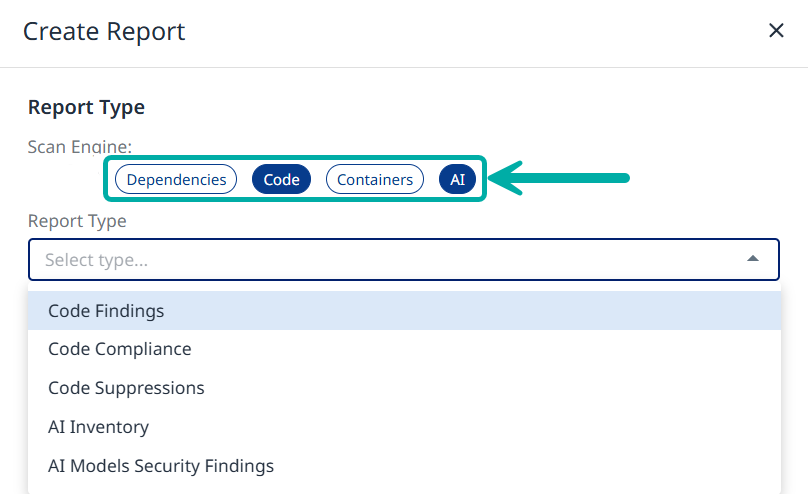
If you wish to only display reports of specific scan engines (AI/SCA/SAST/Container), you can easily achieve this, by making sure only the relevant scan engines are selected:

Listing Mend AI and Mend SAST Reports
Note:
AI = Mend AI
Dependencies = Mend SCA
Code = Mend SAST
Containers = Mend Container
Paging
The maximum number of reports per page is 50. When you exceed that number, you will be able to navigate back and forth between the pages, to view additional reports using the navigation panel at the bottom-right corner of the UI.
You can navigate to the next/previous page using the interior buttons of the navigation panel
You can also navigate to the first/last page using the exterior buttons of the navigation panel

Create your Reports
Click the ‘Create’ button to spawn the Create Report pane on the right side of the screen.

For more information on creating each report type, please refer to the linked reports in the Use Case for Each Report Type section of this article.
Download your Reports
The most recently generated report will be displayed at the top of the reports table.
Select the desired report by checking the box next to it. This will highlight the entire line.
Click the Actions button (
 ) at the right edge of the highlighted line.
Click ‘Download’.

