Overview
As Security Champion or AppSec manager, you will be reviewing the top Applications and Projects with high-severity custom-code security findings. You will want to drill down into them to review their summaries and findings, including their information, data flows / code, and suggested remediations.
Getting it done
Review the top Application with highest severity Custom-Code Security Findings
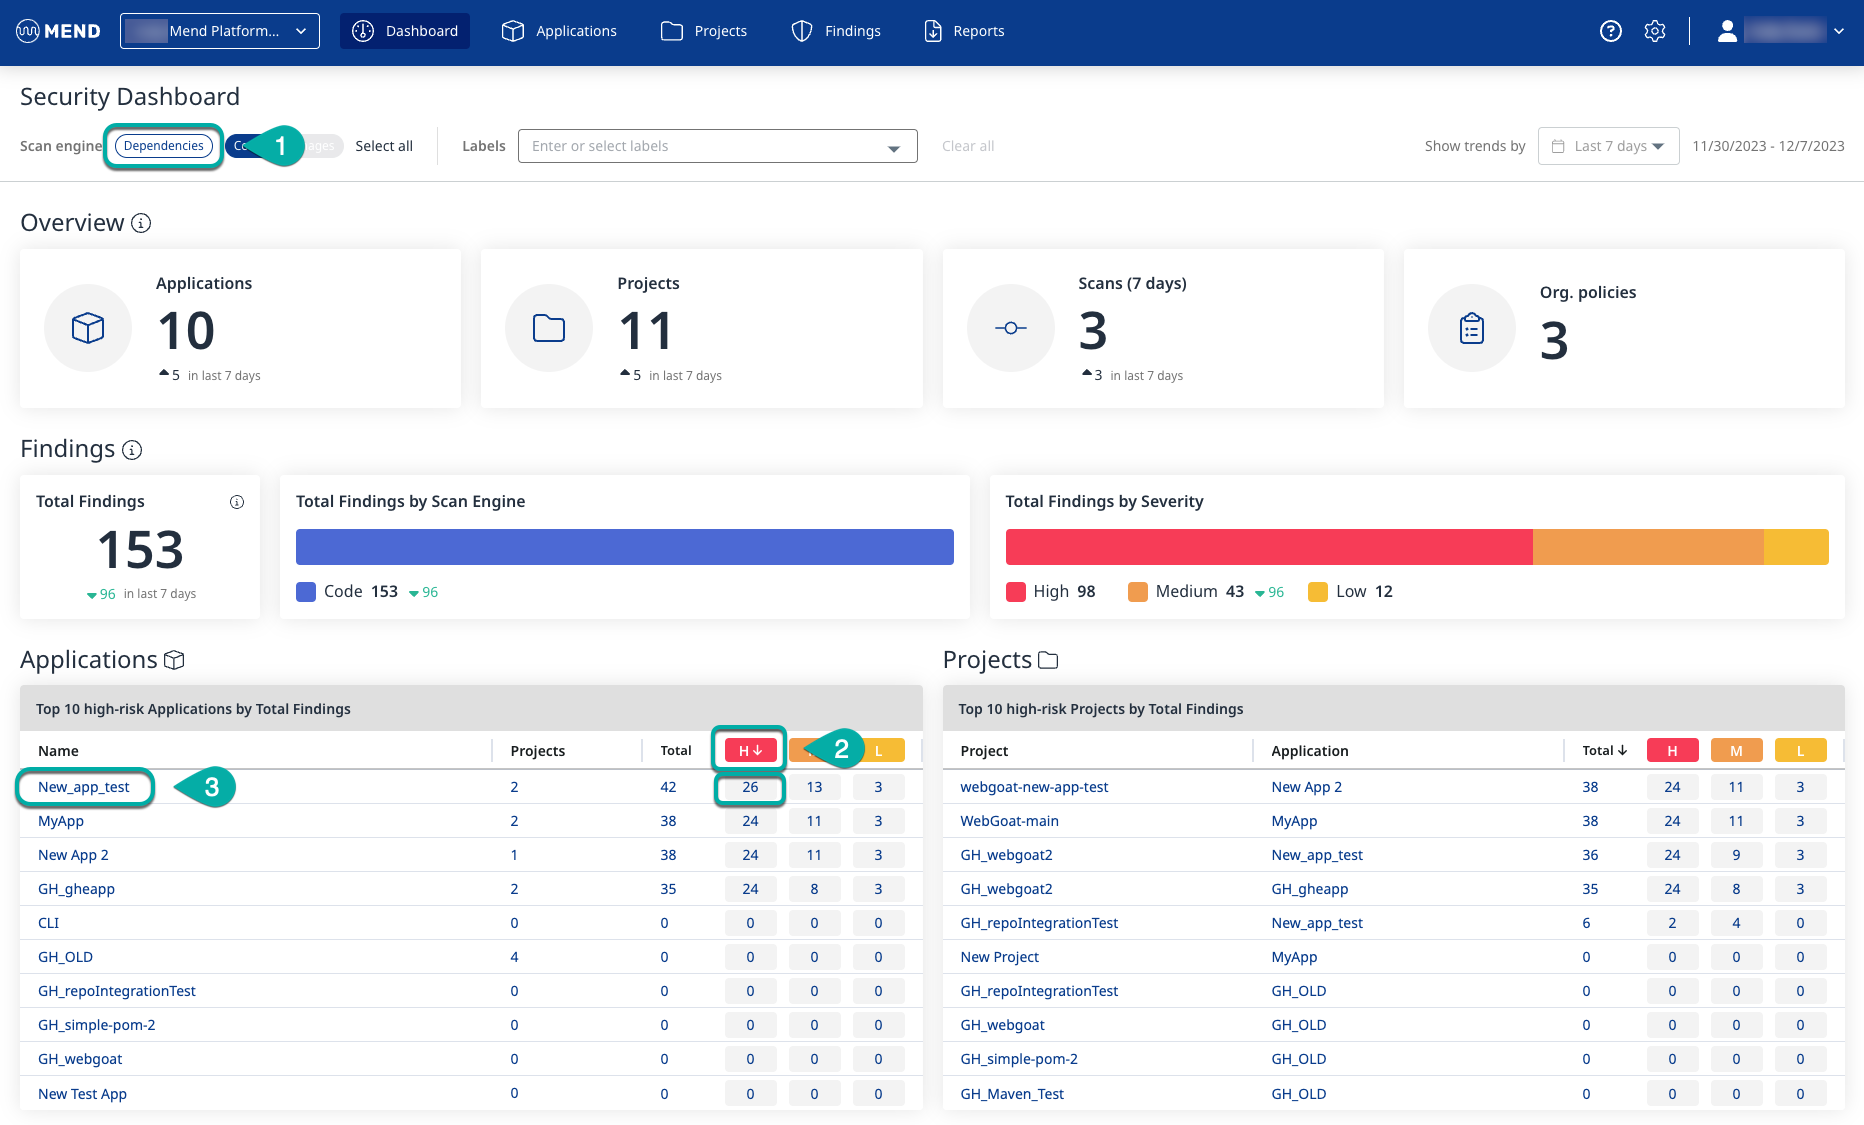
Beginning on the Mend Application Security Dashboard, ensure only the Code Scan engine is enabled.
-
Click the Dependencies Scan engine to disable it if it isn’t already.
By default, the Applications widget showing the Top 10 high-risk Applications by Total Findings is ranked by the total number of findings.
-
Click the “H” in the red box on the Applications widget to rank by most high-severity findings.
If multiple applications are tied for the selected ranking order, they are listed alphabetically.
-
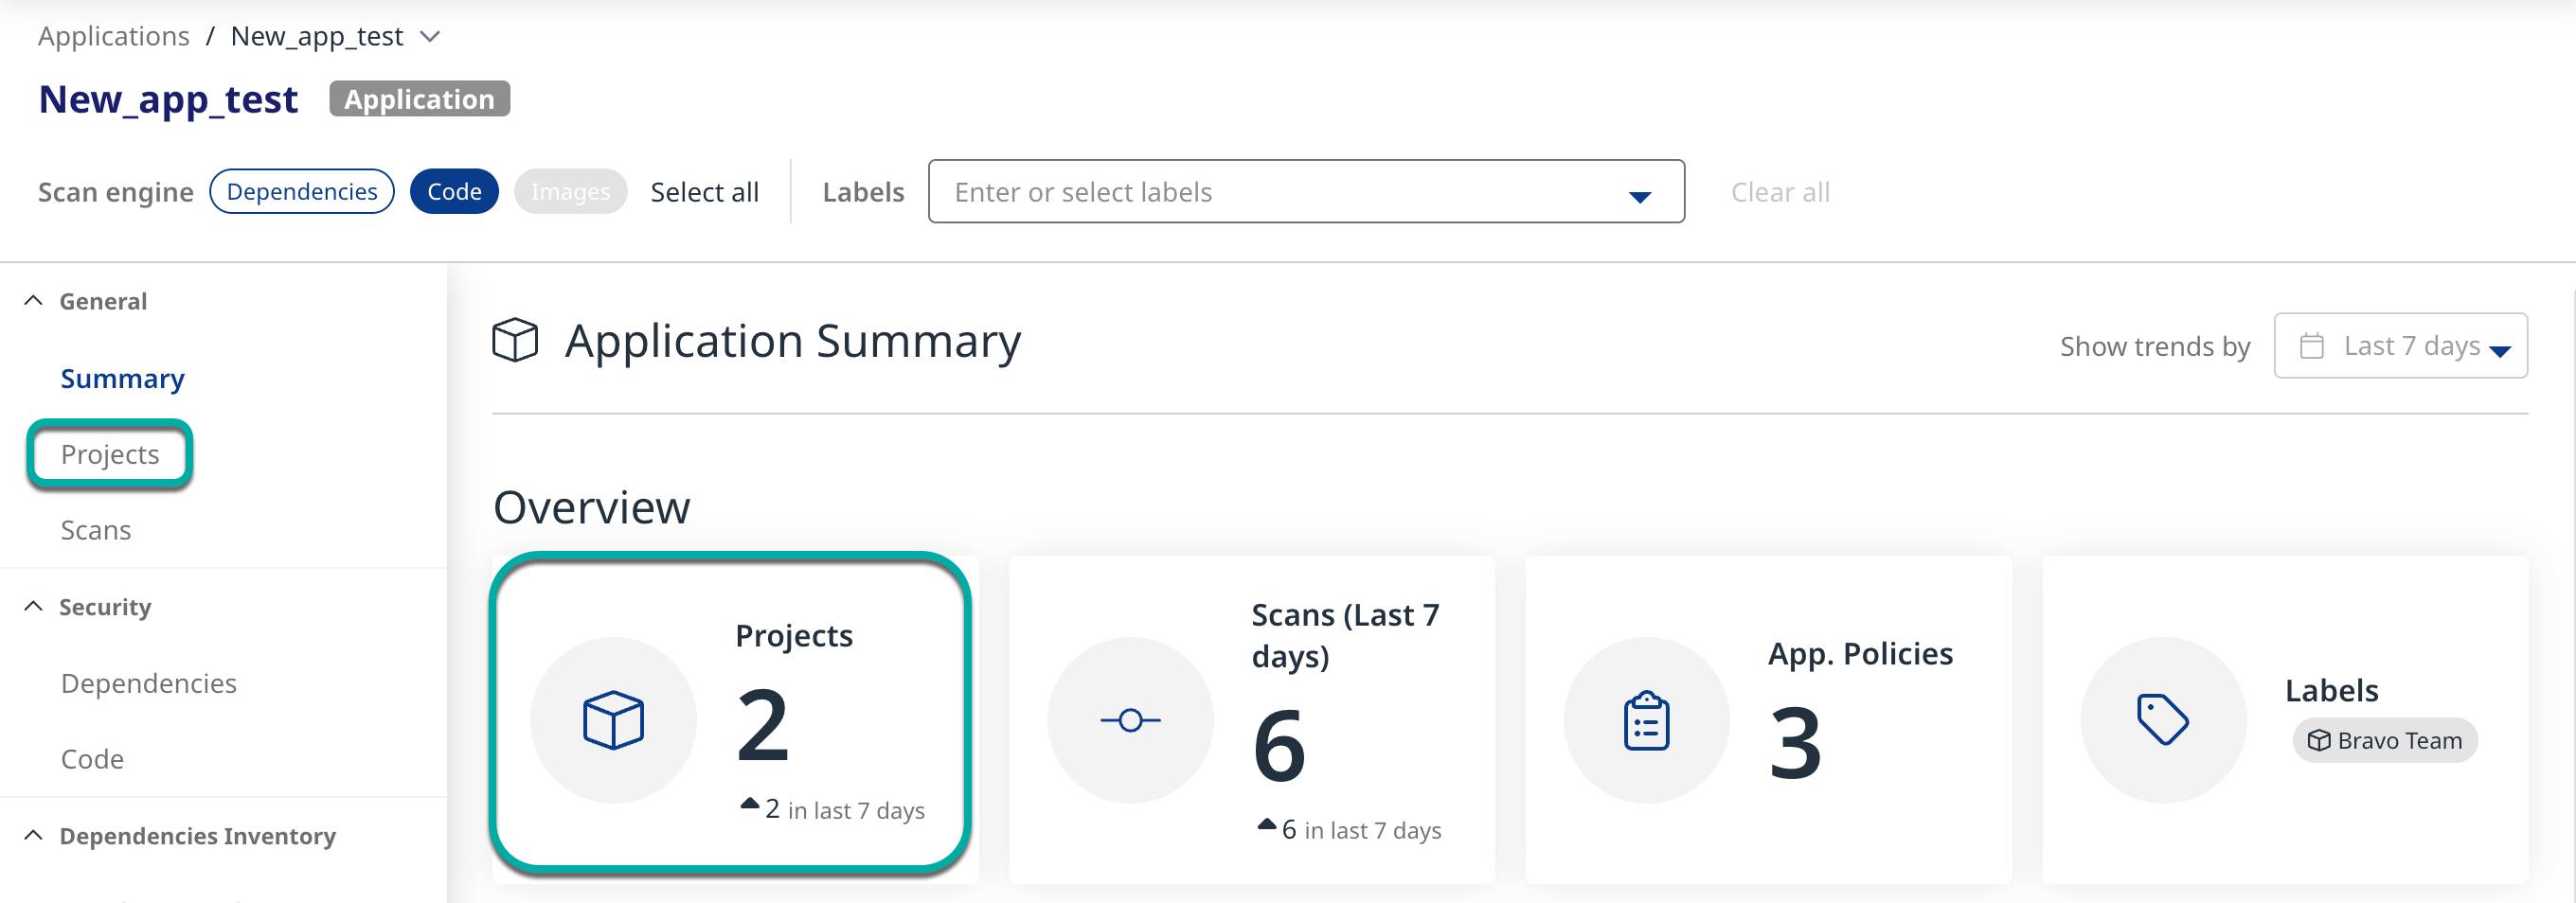
Click the Application that has been sorted to the top with the most high-risk findings. You will be redirected to that application's summary page.
-
Click Projects in the left pane or click the Projects widget in the Overview section to view the Projects associated with the Application.
Review the top Project within the Application with high-severity Custom-Code Security Findings
-
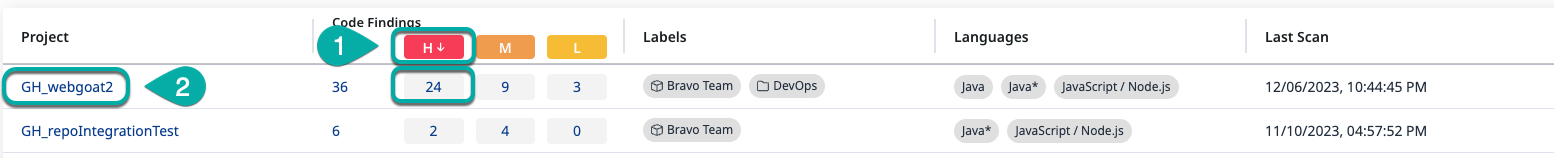
Click the “H” in the red box on the Projects table to rank by most high-severity findings.
-
Click the Project that has been sorted to the top with the most high-risk findings. You will be redirected to that project's summary page.
-
Click Code in the left pane or the Total Findings by Scan Engine widget in the findings section to view the latest code findings associated with the Project.
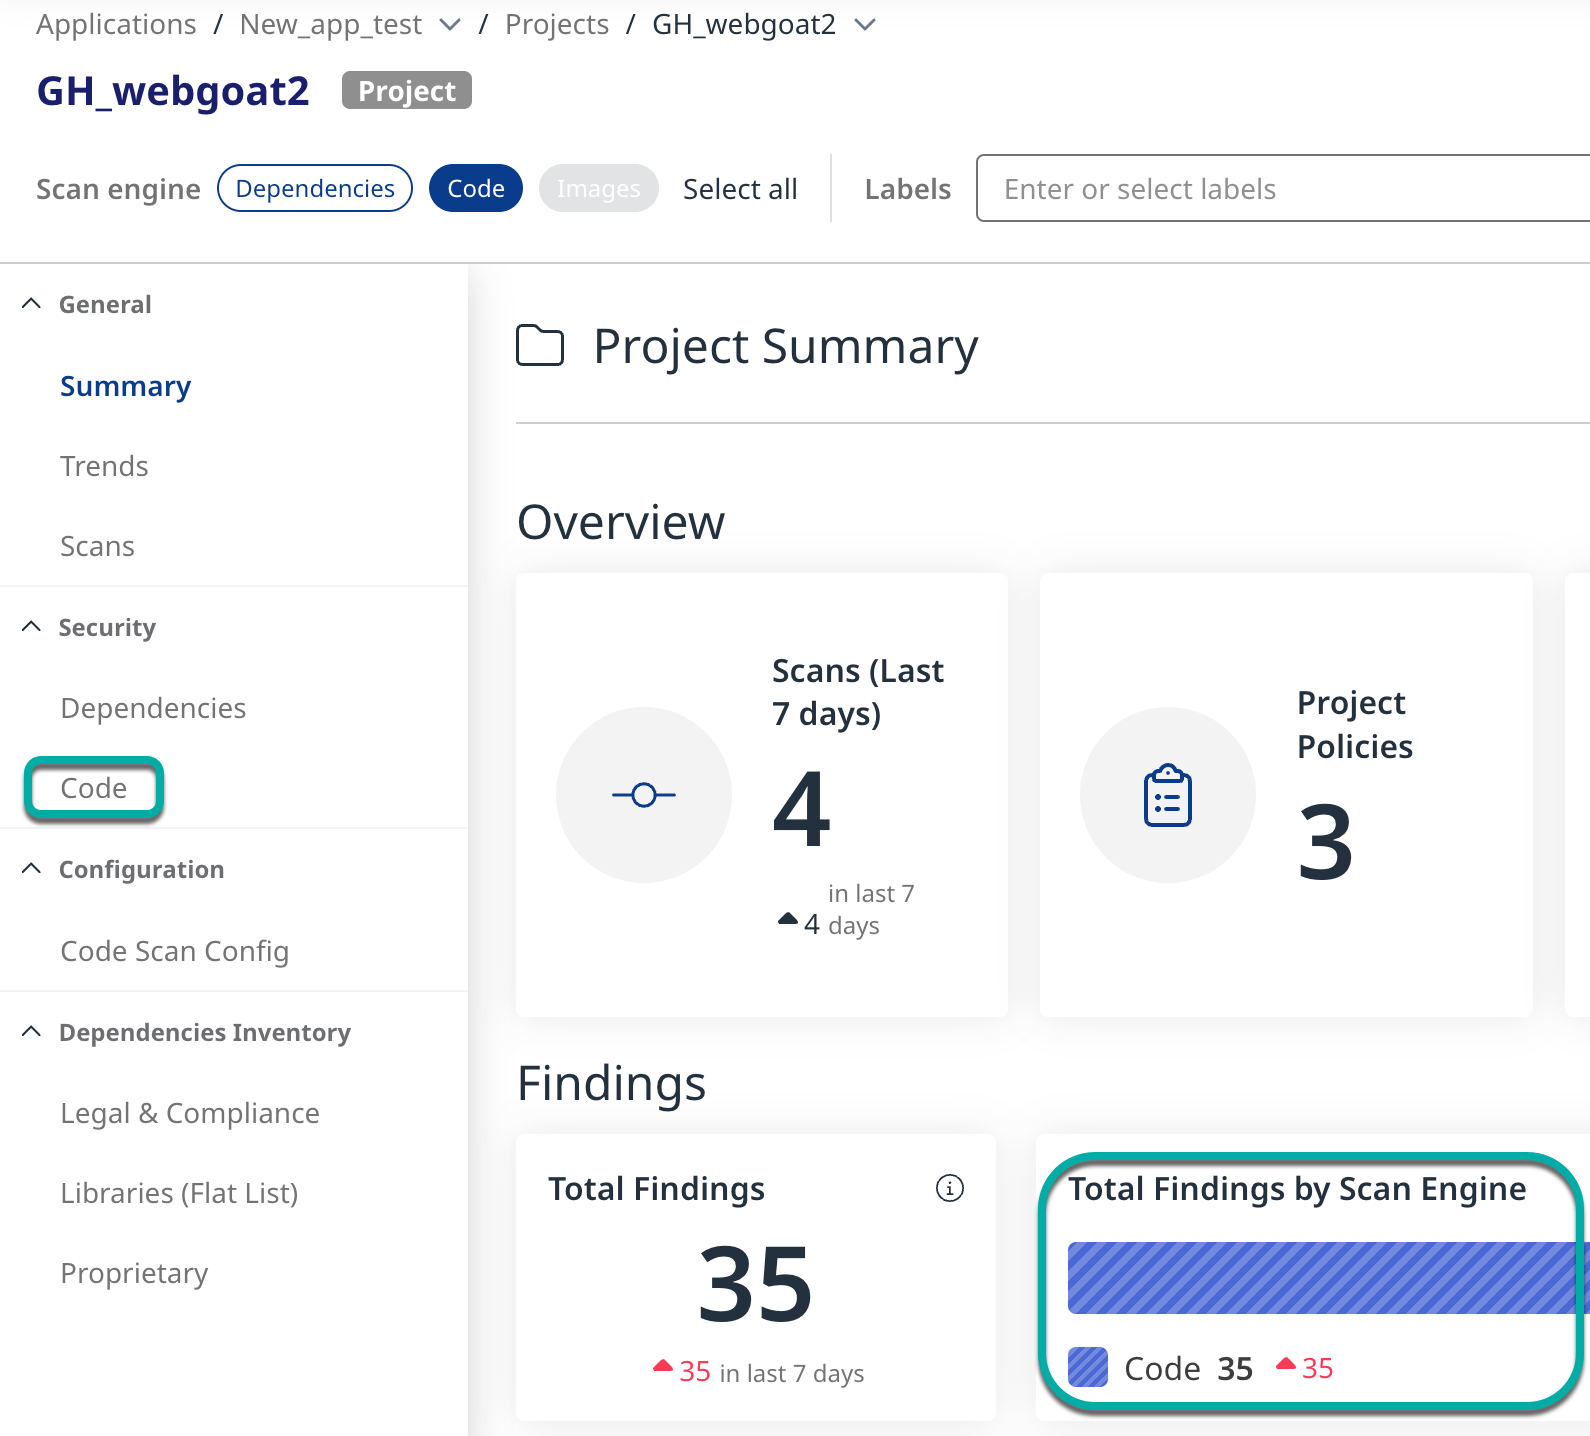
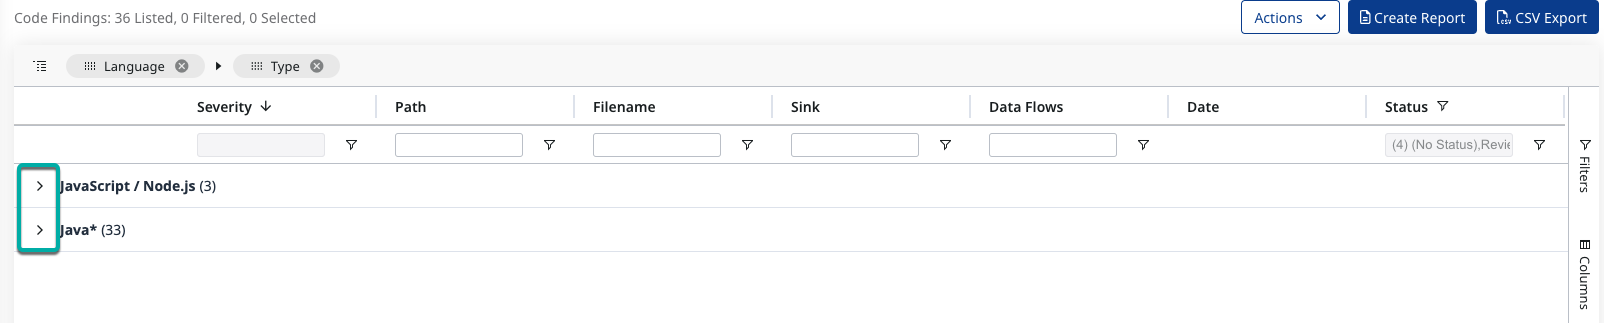
By default, the code findings are grouped by Language and Type and presented in a collapsed state.
-
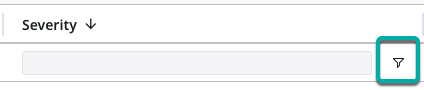
Click the Severity column's filter icon.
-
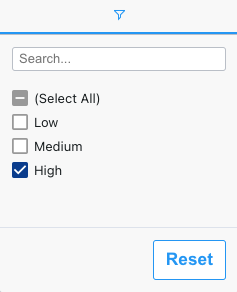
Select High to restrict the findings table to only show the highest-risk findings.
Reviewing the High-Risk Findings
-
Expand the findings.
-
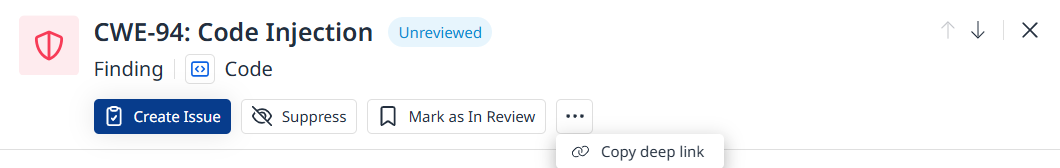
Click a high-risk finding to spawn the finding side-panel, showing the details of that finding on the right side of the screen.
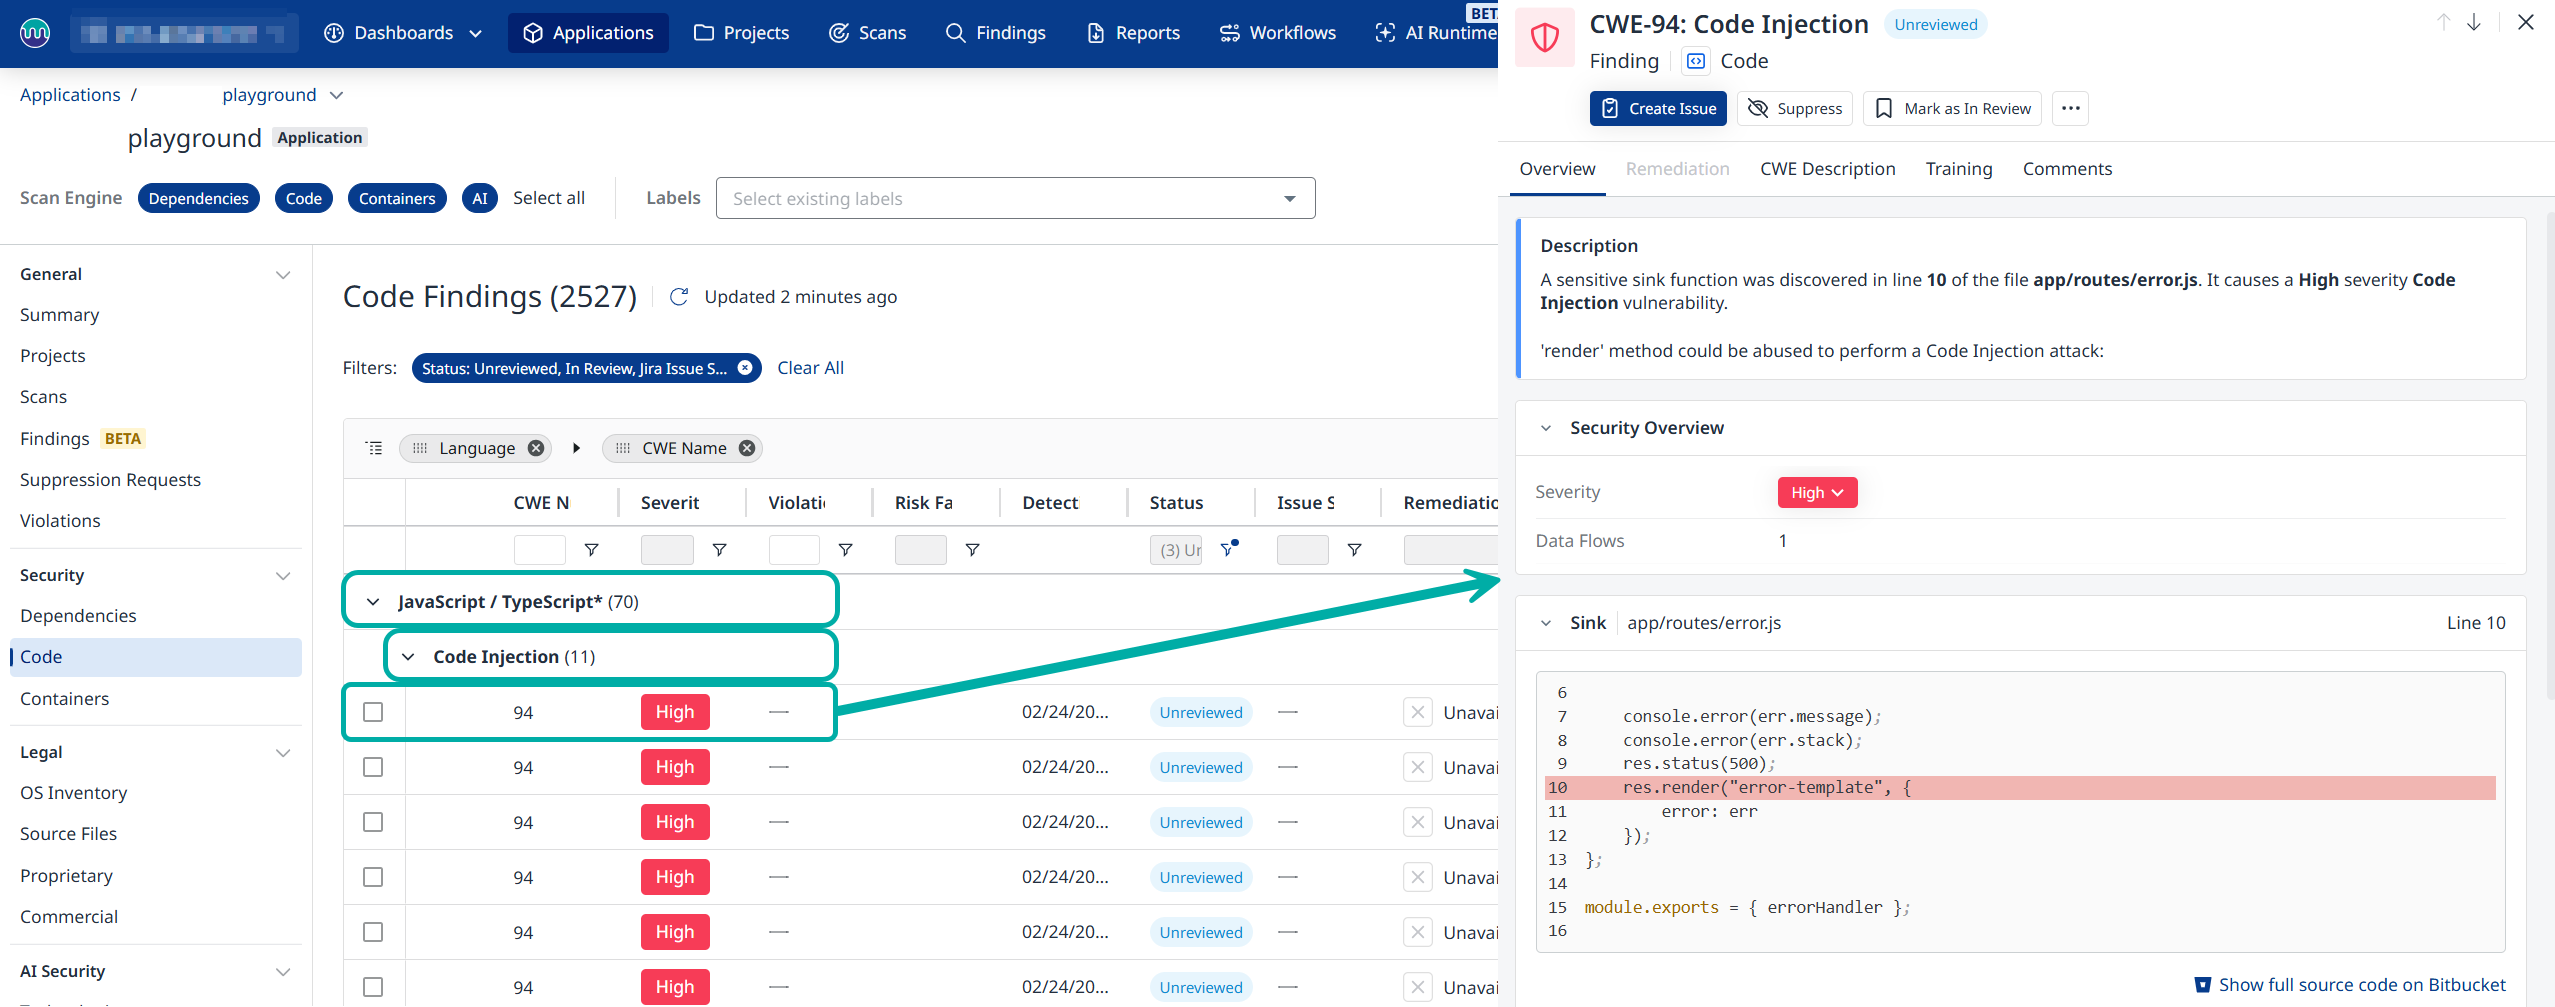
The buttons at the top of the side-panel allow you to perform the following actions:
-
Create Issue - Create a Jira issue (requires Jira Integration installed and configured).
-
Suppress / Unsuppress
-
Mark as In Review - Mark the finding as Reviewed
-
… - Copy deep link
To close the finding details window, click the “X“ in the top right corner.
Overview
The finding side-panel defaults to the Overview tab, which contains the following sections:
-
Description
-
Security Overview
-
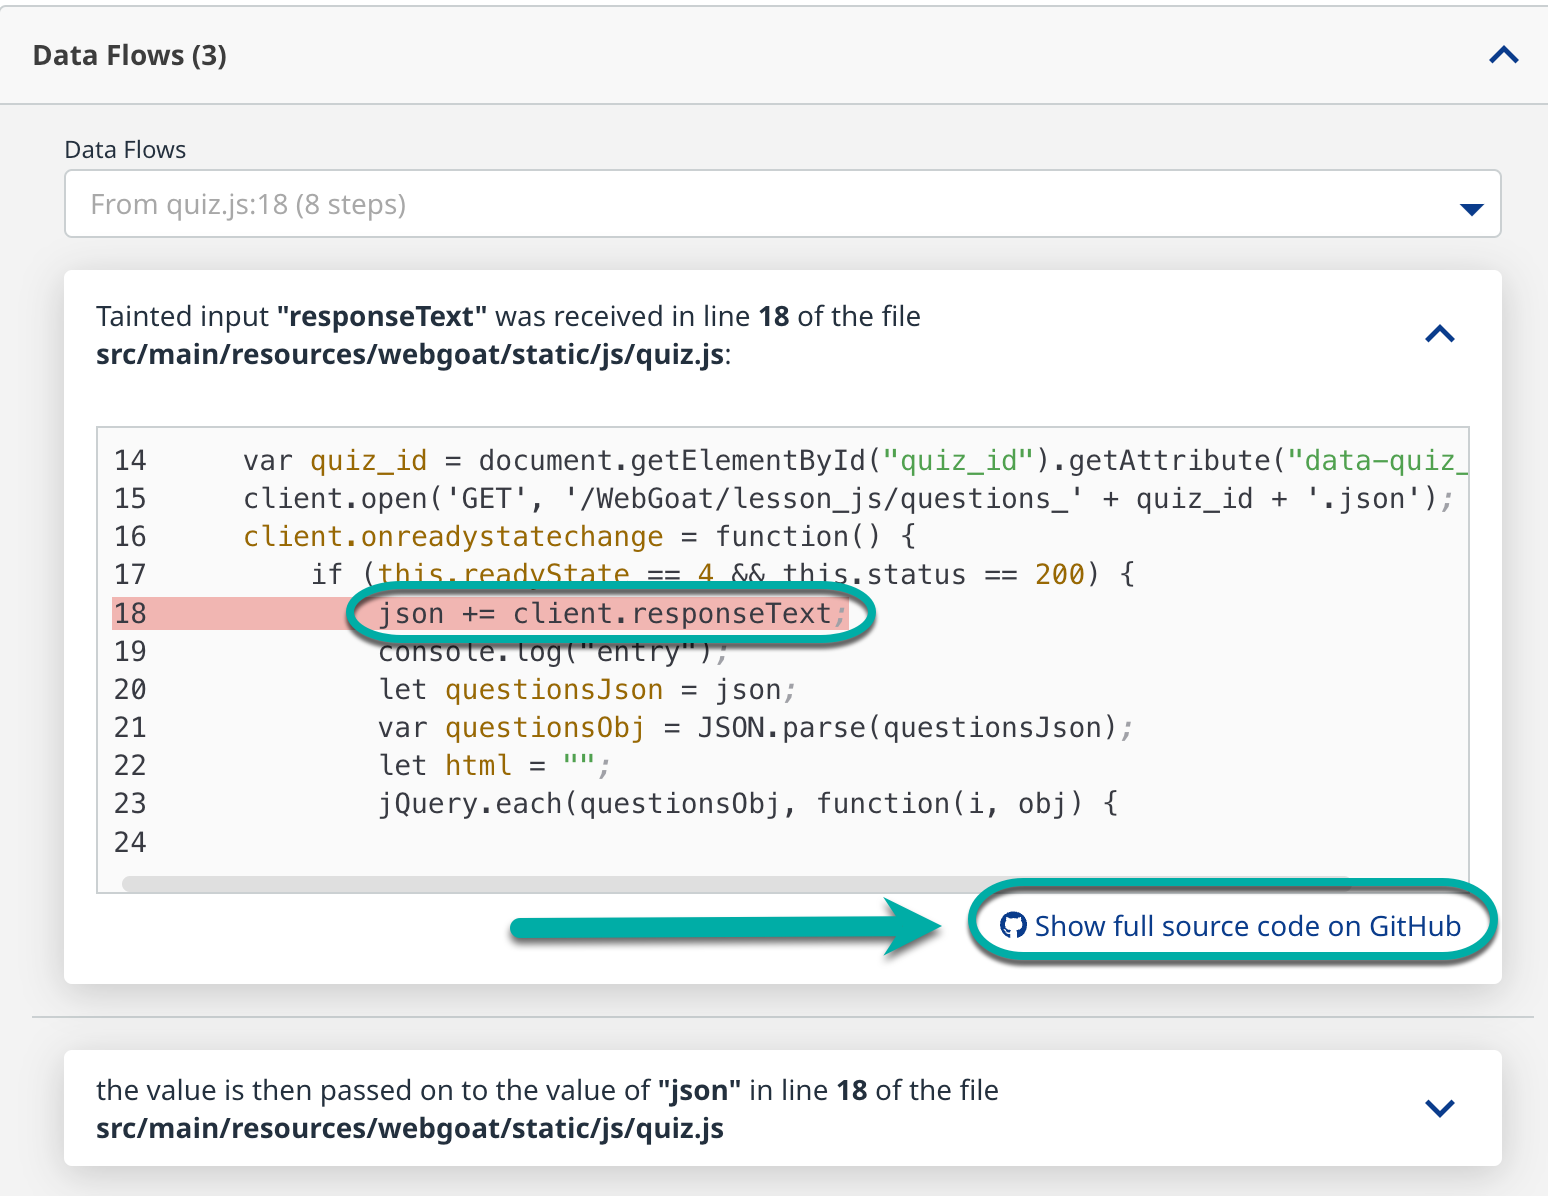
Data Flows
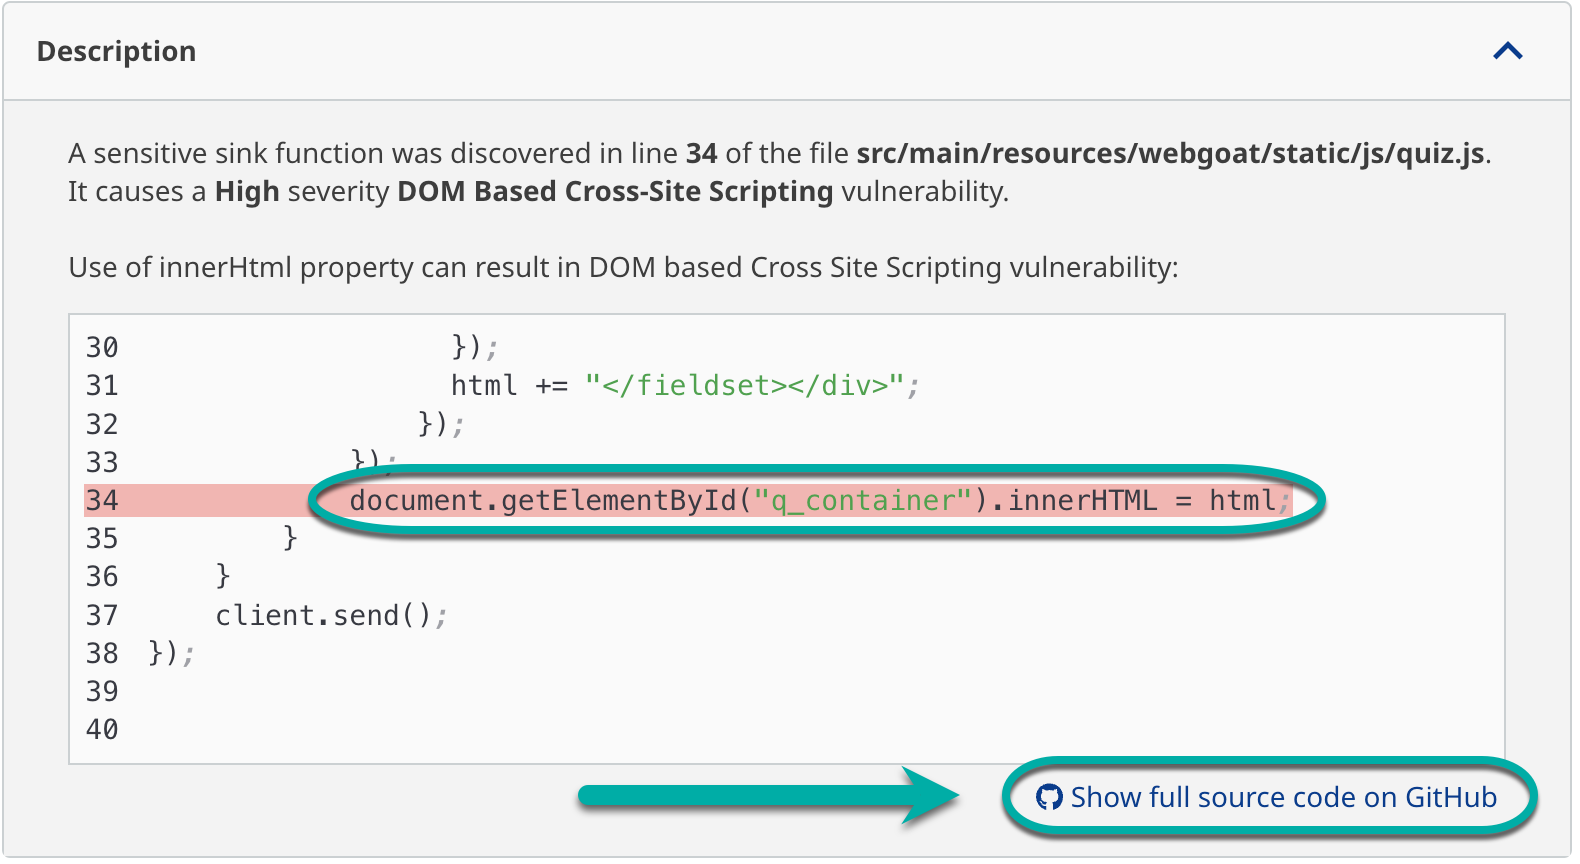
Description
Briefly describes the finding and provides the path to the affected file within the Project, the line number for the affected line of code within the file, and a snippet of the code with the affected line highlighted. At the bottom of the Description section is a link to view the entire source code of the affected file in GitHub.
Security Overview
Here you can change the severity of the finding by clicking it and selecting a different severiity level.
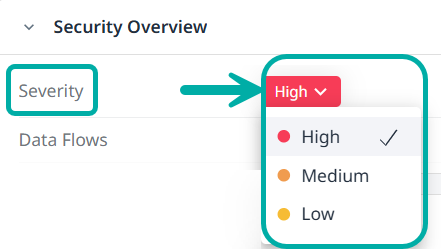
Note: Severity is based on SCA data and takes into account all reported CVEs for a certain CWE.
For each CWE a weighted average CVE score is computed from:
-
The CVSS attack vector (confidentiality, integrity, availability) for all CVEs
-
A weighted average CAPEC score (severity and likelihood)
Example: SQL Injection
-
Severity Score → 8.4 (aggregated from ~20k data points)
-
CVEs total score → 8.6 (aggregated from ~20k data points)
-
CAPECs total score → 8.2 (aggregated from a dozen data points)
-
Data Flows
This section lists each file in the project where data is passed through and is affected by the finding. Each item in the Data Flows section will also briefly describe the finding and provide the path to the affected file within the project, the line number for the affected line of code, and a snippet of the code with the affected line highlighted. The bottom of each item in the Data Flows section also has a link to view the entire source code of the affected file in GitHub.
Remediation
The Remediation tab contains the AI-based remediation (if applicable).
See Remediate your Code Findings for more details.
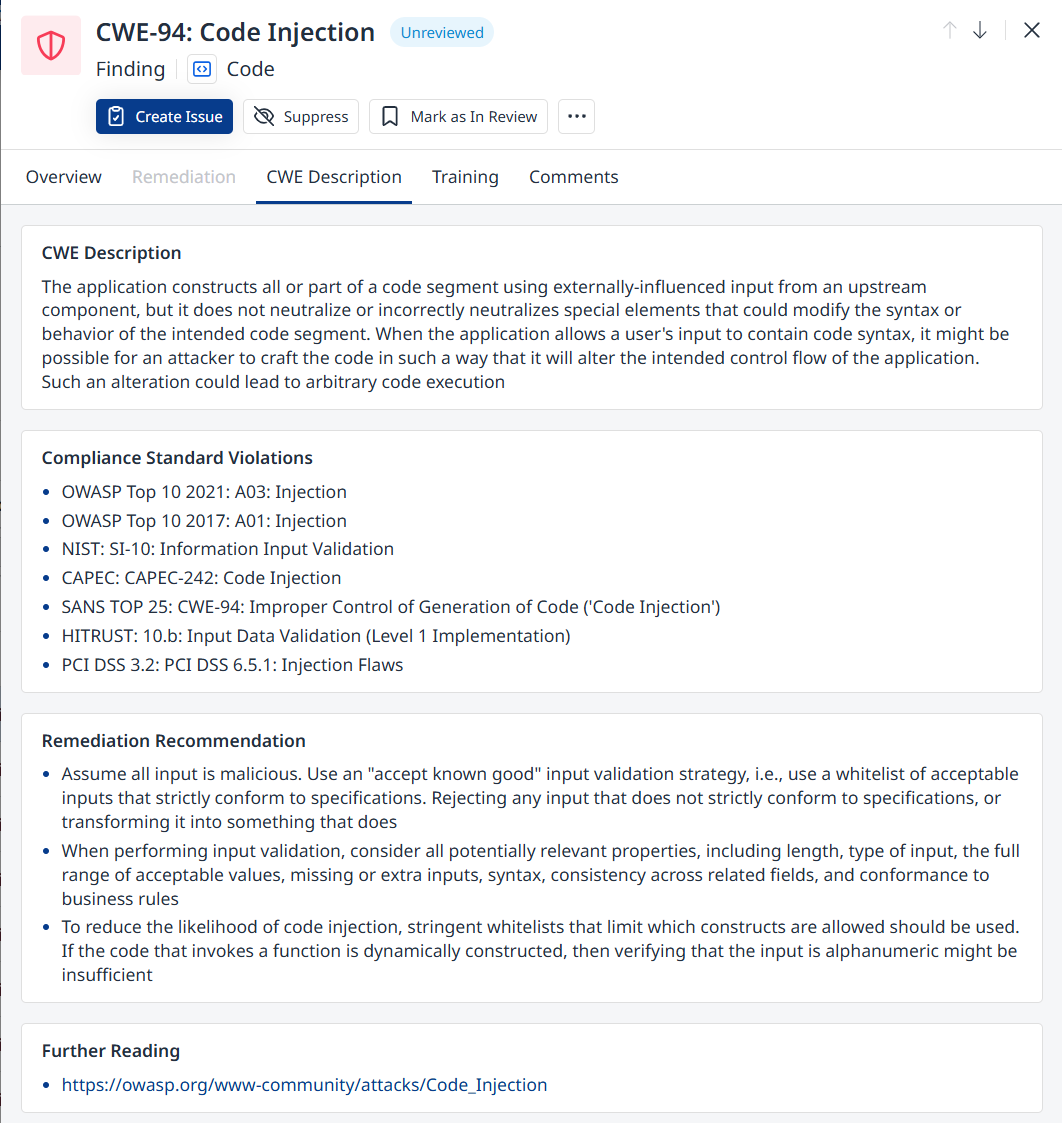
CWE Description
The CWE Description tab provides a description fo the CWE alongside generic recommendations pertaining to the finding in question.
Training
See Secure Code Warrior for details.
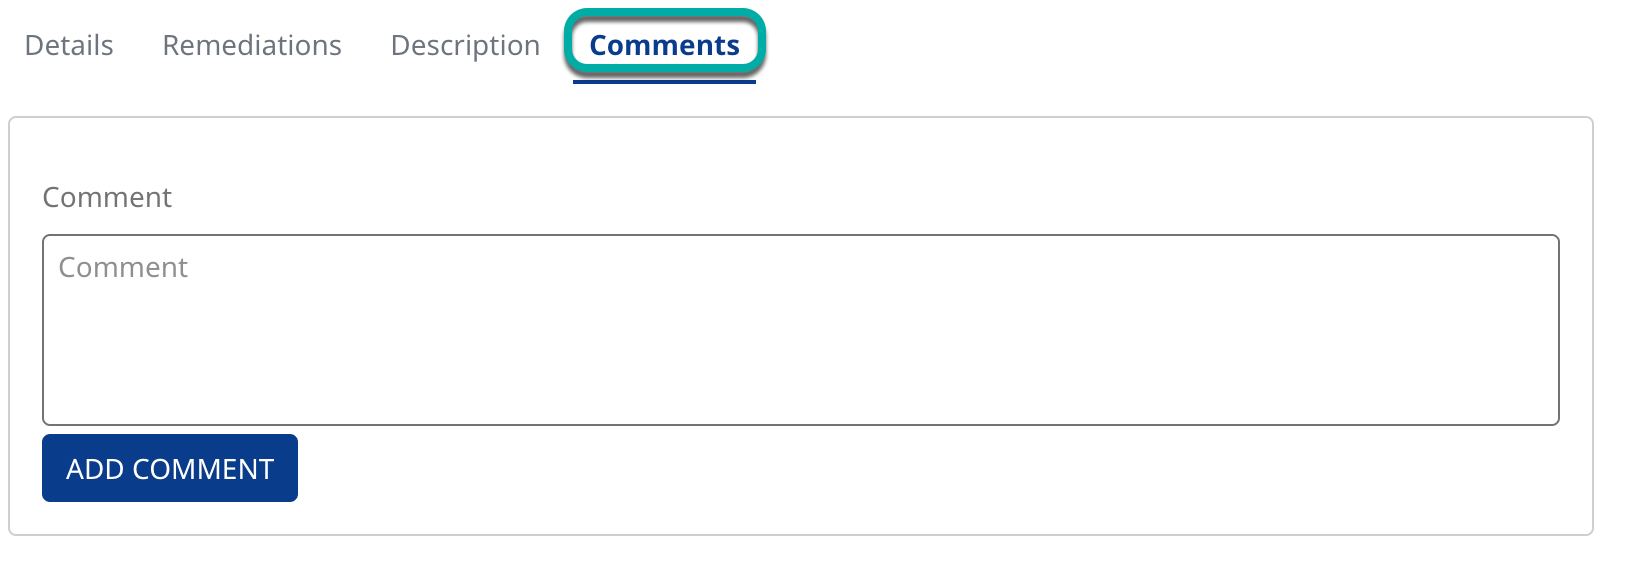
Comments
The Comments tab of the finding details window allows you to comment on the finding.