Overview
The Mend Platform Application Summary Dashboard provides a high-level overview and analytics of SCA, SAST, Container and AI scan findings for all Projects associated with the Application.
Getting it done
The Mend Platform Application Summary Dashboard is divided into five sections. Data filtering is at the top, followed by the Overview, Findings, Findings Details, and Inventory sections.
Data filtering
The data filtering section of the Mend Platform Application Summary Dashboard offers three ways of refining the findings being displayed: by scan engine, by label, and by trend. These filtering methods can be used individually or combined to drill down into the most granular results.
Scan engines
The findings from the various scan engines can be toggled on or off, allowing you to review them 1 at a time or all at once.
Note: The scan engine must be enabled for your organization by a Mend Admin before it can be used by you to display scan findings.
Labels
Labels can be used to refine the findings on the Mend Platform Application Summary Dashboard to display only results for Projects within the current Application with the listed Labels assigned.
Trends
Trends can be used to refine the findings displayed on the Mend Platform Application Summary Dashboard to only results within the past 7 days, 30 days, 90 days, 180 days, or the Last year.

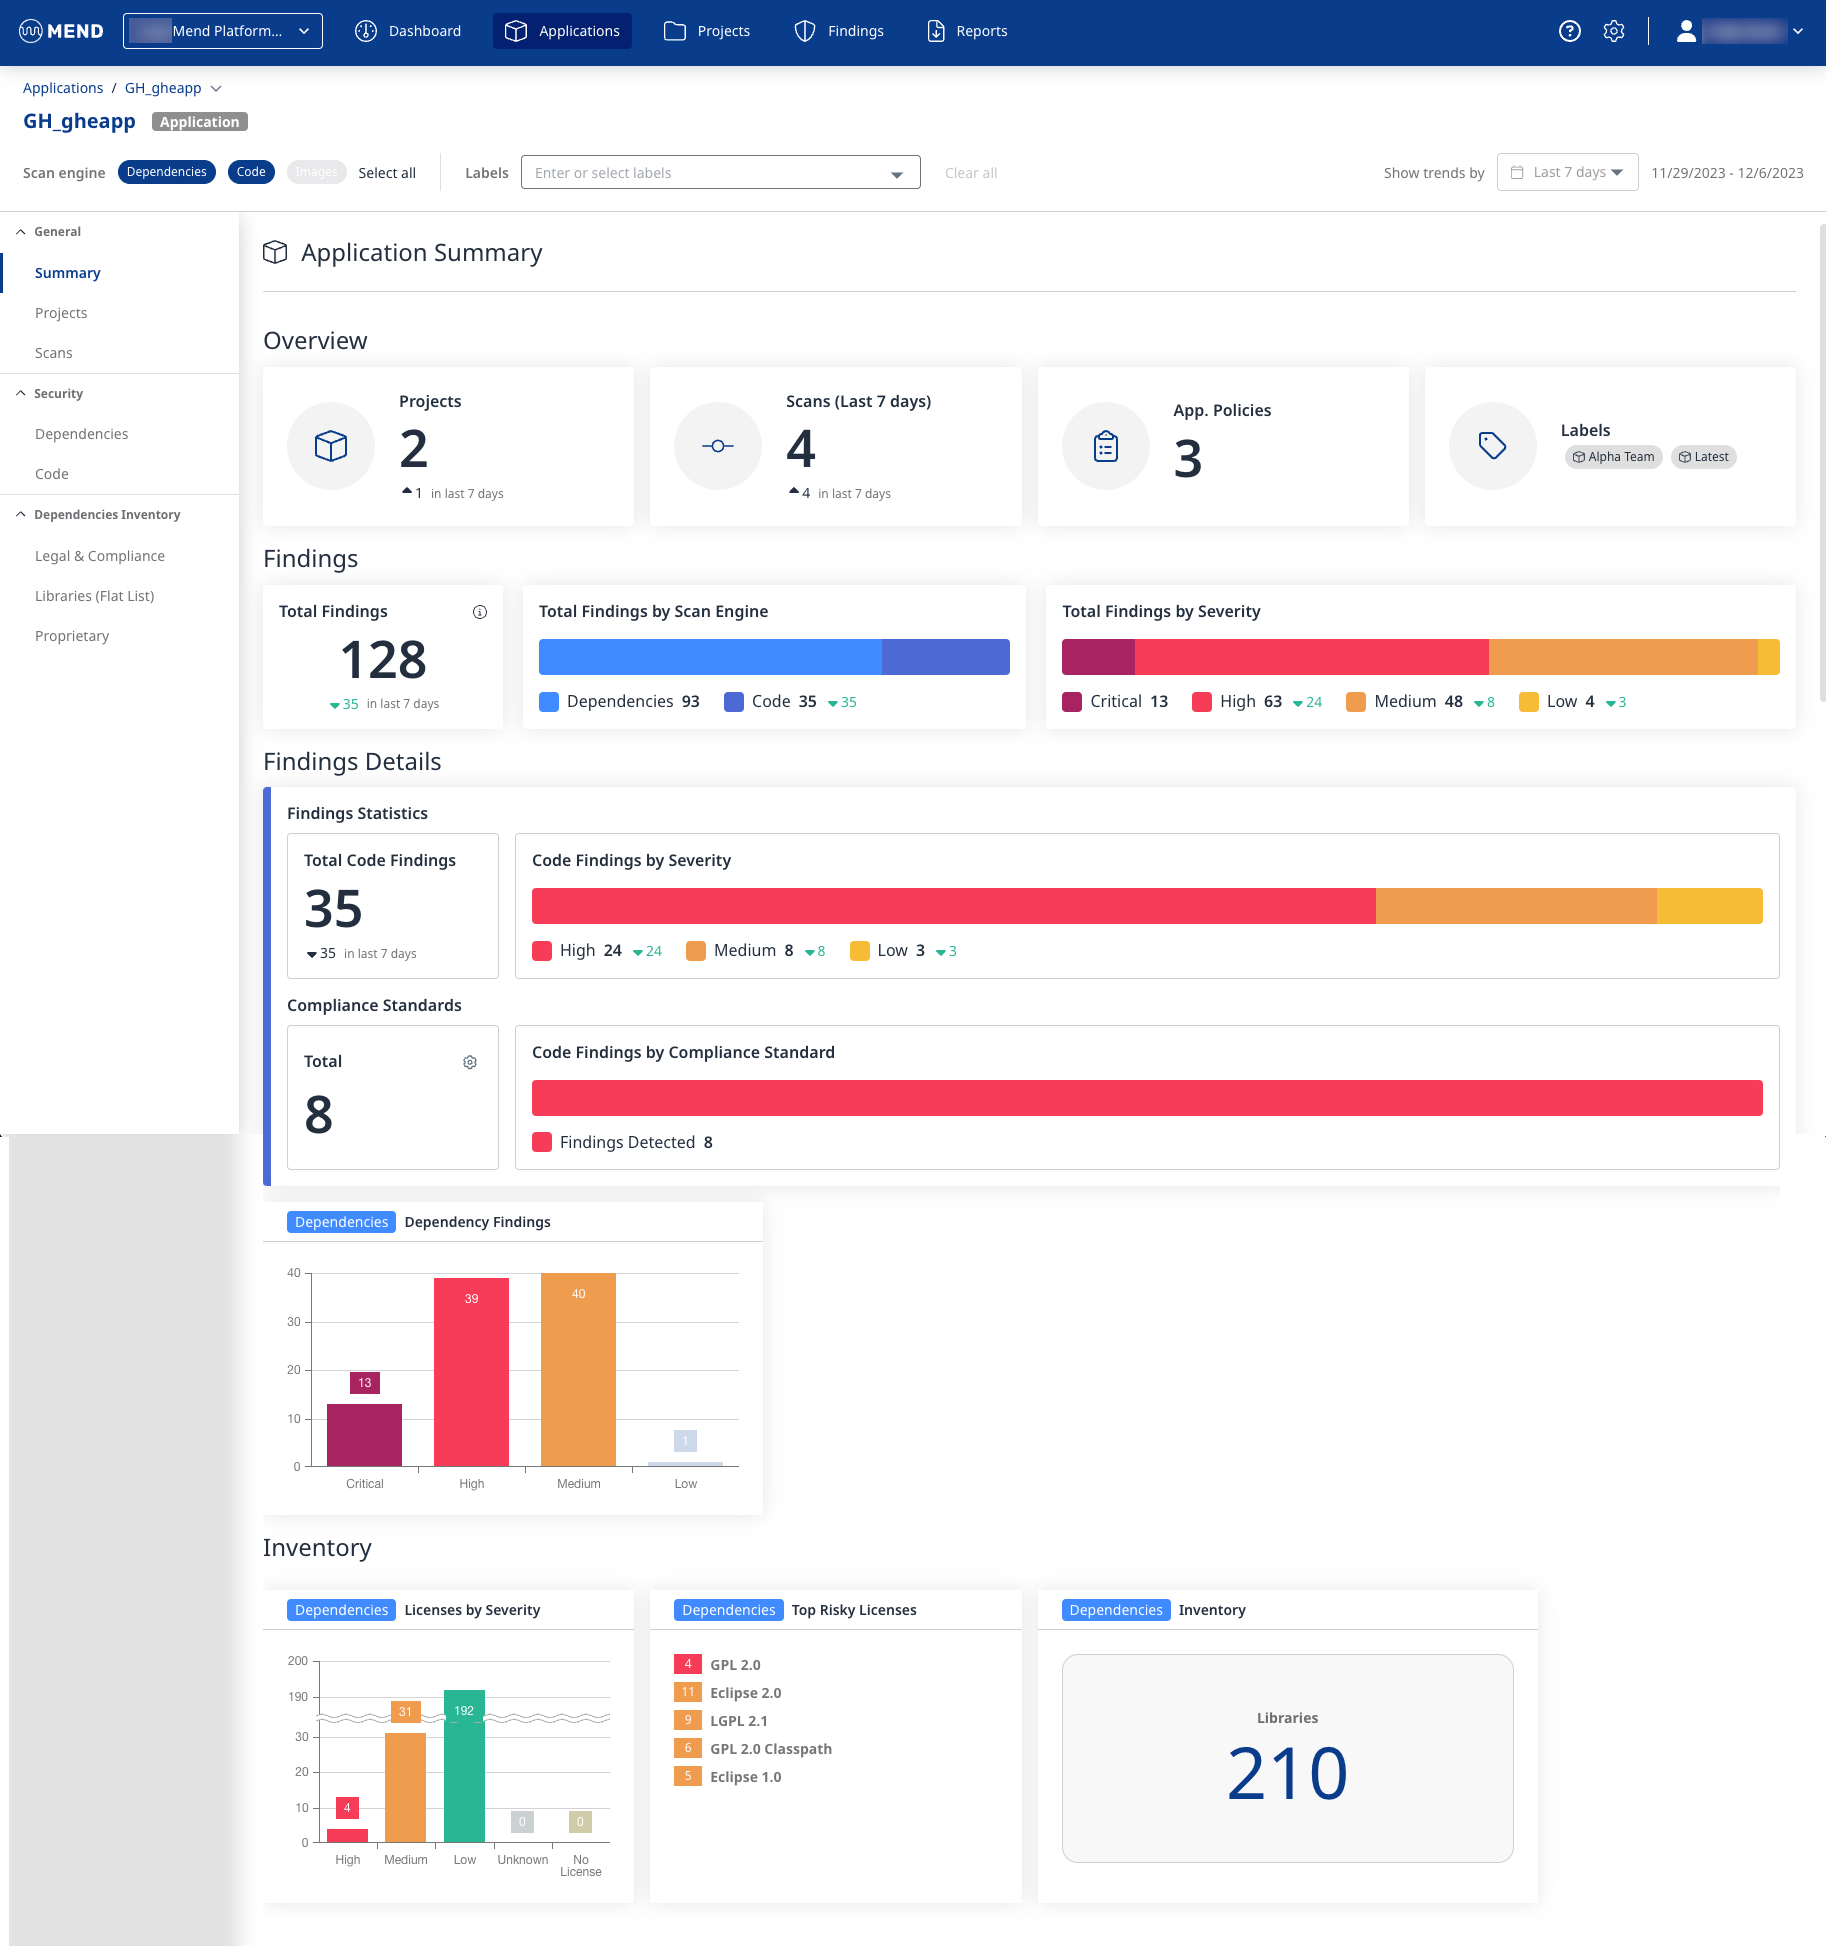
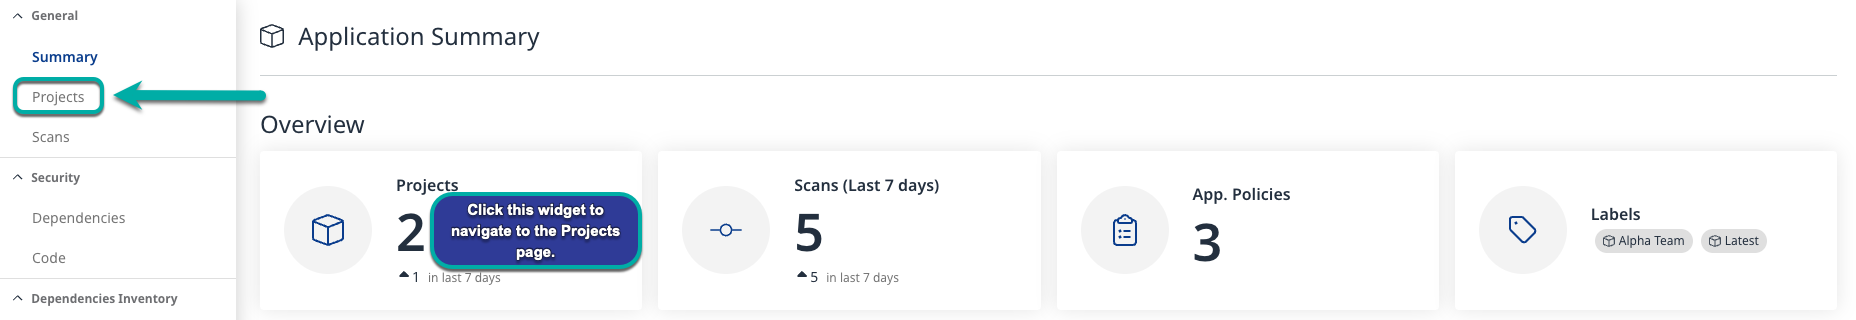
Overview
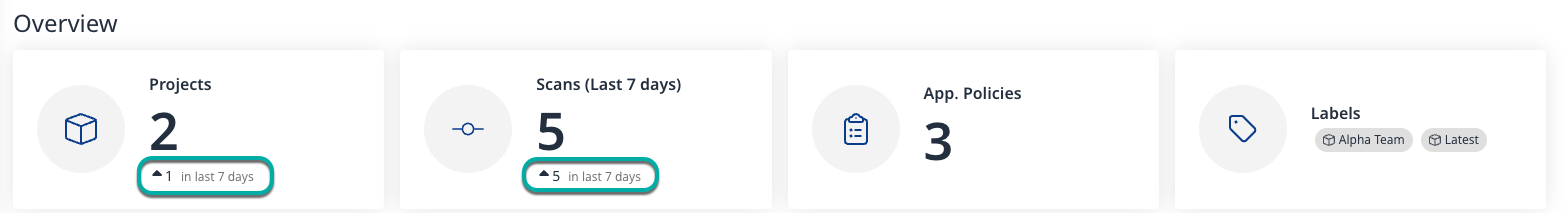
The Overview section comprises four widgets: Projects, Scans, App. policies, and Labels.
-
The Projects widget shows the total number of Projects associated with the current Application that have been scanned. This widget, if clicked, links to the Projects page.
-
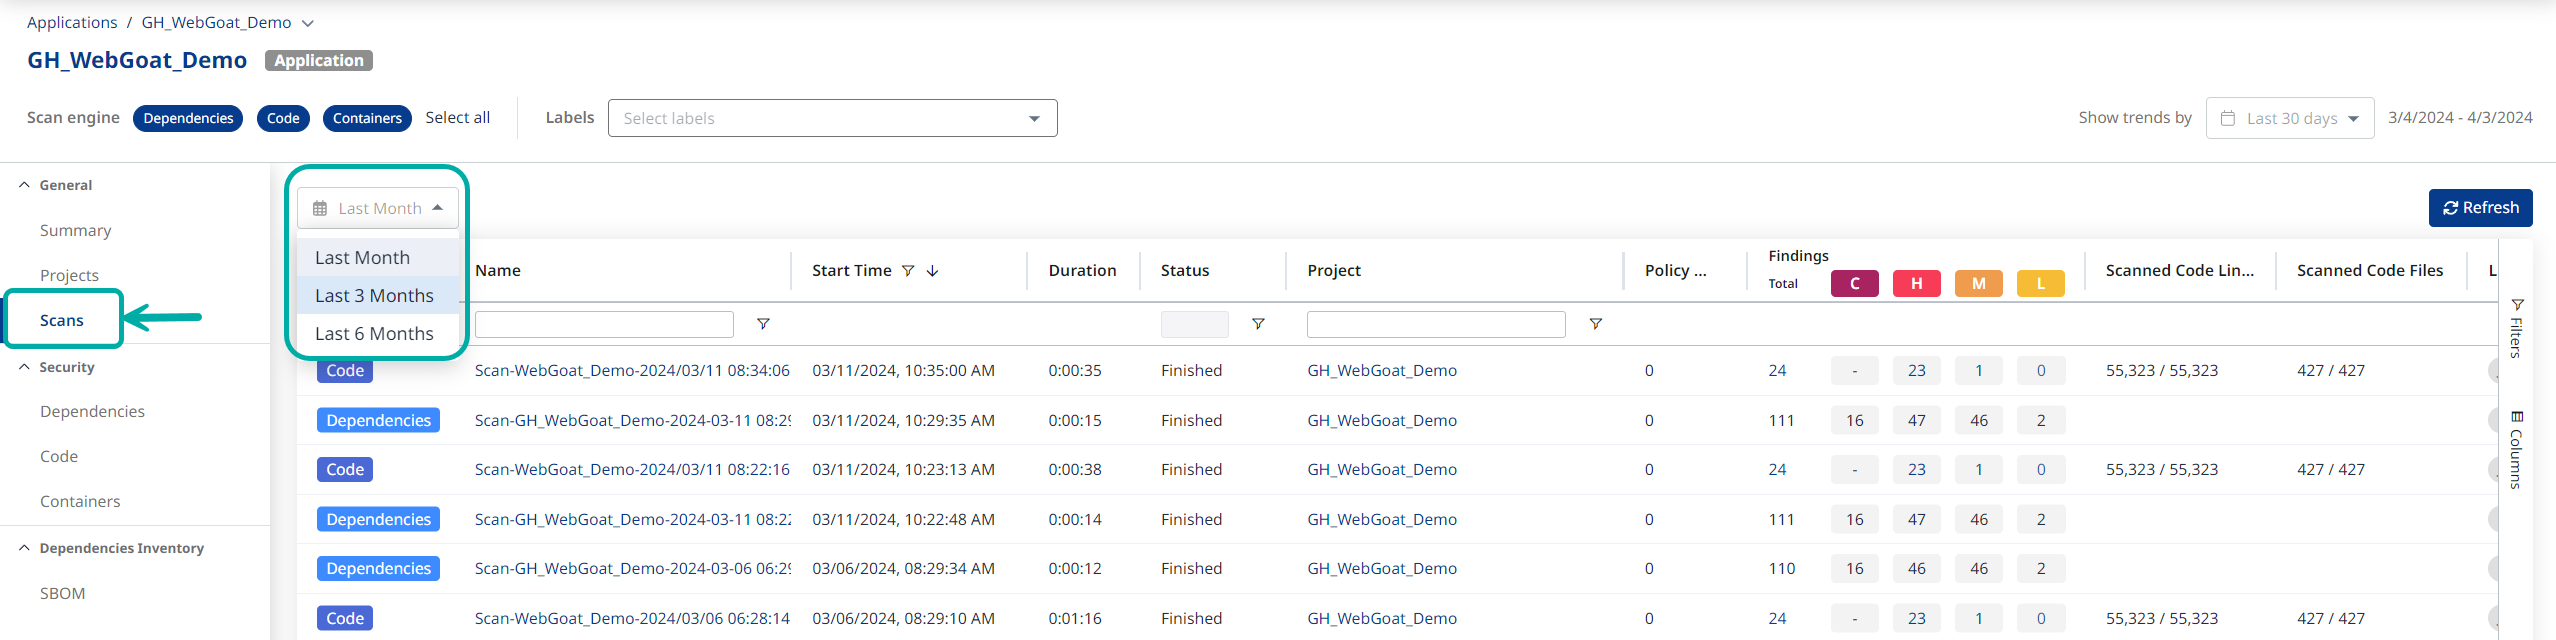
The Scans widget shows the total number of Scans performed on all Projects associated with the current Application. This widget, if clicked, links to the Scans page.
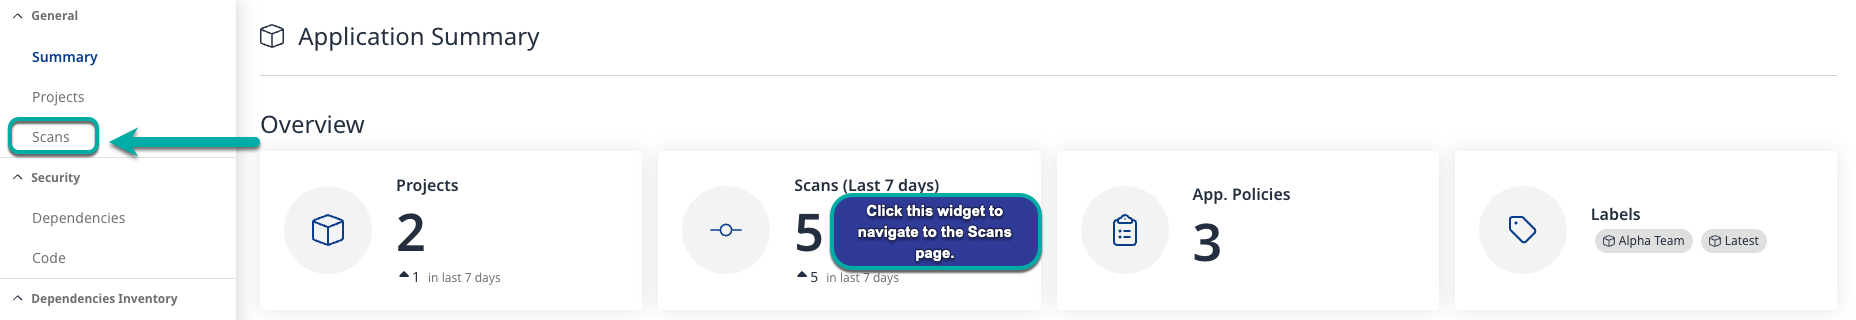
In the Scans page you can see a history of the scans that took place in your application Here you can apply various filters as well as add/remove and reorder columns (as explained here), and you can also select one of the predefined time ranges from the dropdown menu (Last Month / Last 3 Months / Last 6 Months).
-
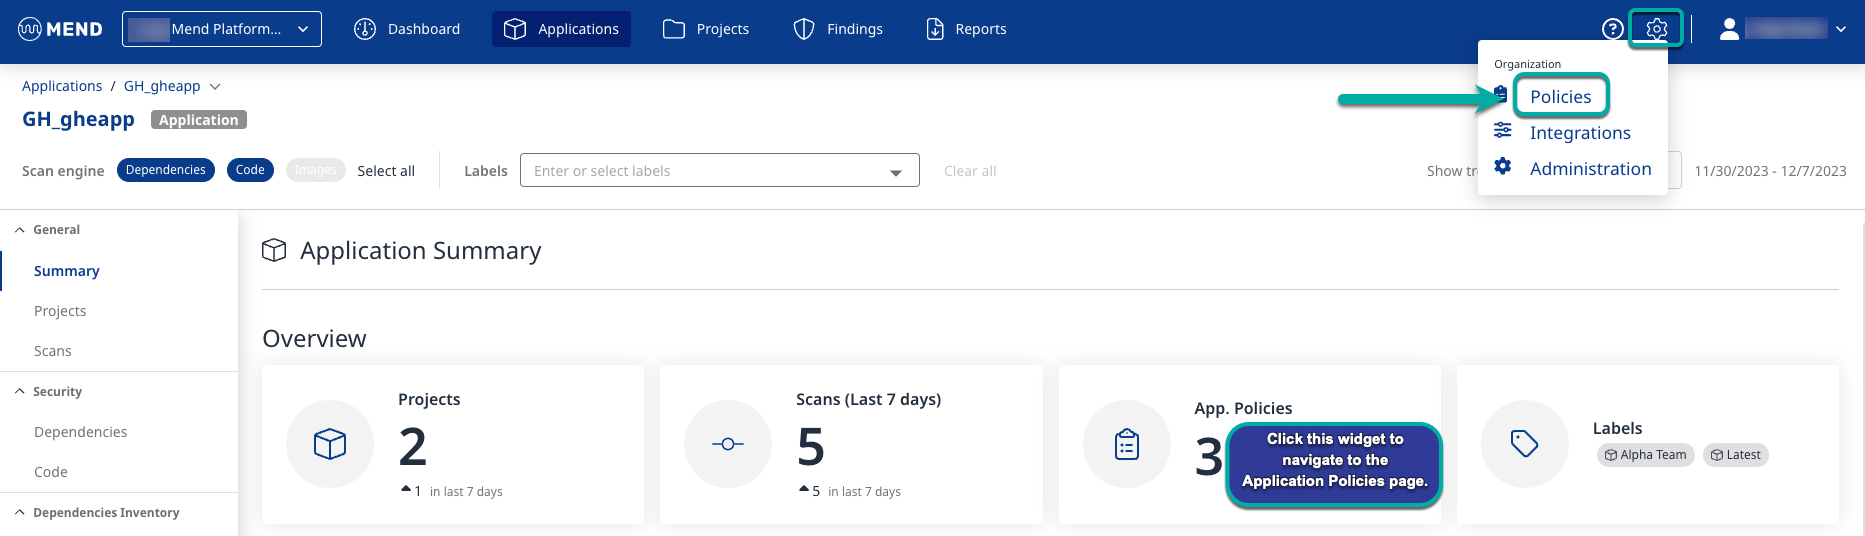
The App. Policies widget shows the total number of policies created at the Application level. This widget, if clicked, links to the Application’s policy page, which is found in the settings menu.
-
The Labels widget shows the Labels assigned to the current Application
The Projects and Scans widgets reflect the selected time window set by the Trends filter.
Findings
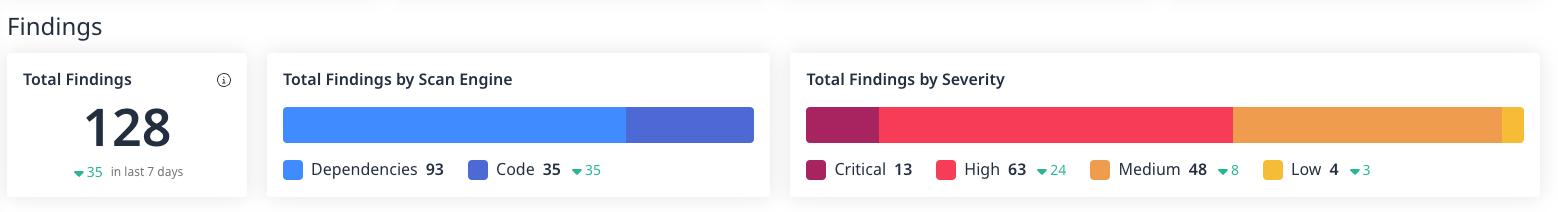
The Findings section comprises three widgets: Total Findings, Total Findings by Scan Engine, and Total Findings by Severity.
-
The Total Findings widget shows the total number of findings from all Projects within the current Application.
-
The Total Findings by Scan Engine widget shows the total number of findings from all Projects within the current Application by each active scan engine within the current application. The different scan engines are assigned a color. The color key is on the bottom of the widget.
-
The Total Findings by Severity widget shows the total number of findings from all Projects within the current Application by severity, Critical, High, Medium, or Low. The different severities are assigned a color. The color key is on the bottom of the widget.
- Hover over a section of the Total Findings by Severity graph to reveal a breakdown of the findings by the Scan engine.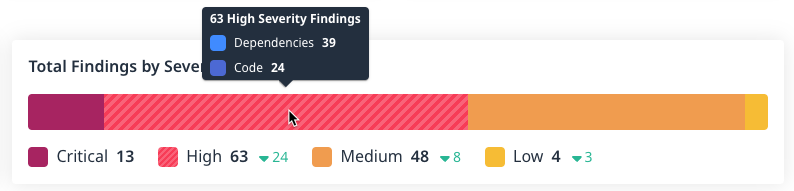
Note: The AI model security findings are not accounted for in the Findings widgets.
They must be consumed separately via the AI Models Security Findings column in the main Applications/Projects views.
Findings Details
The Findings Details section comprises five widgets: Total Code Findings, Code Findings by Severity, Total Compliance Standards, Code Findings by Compliance Standard, and Dependencies.
Findings Statistics
-
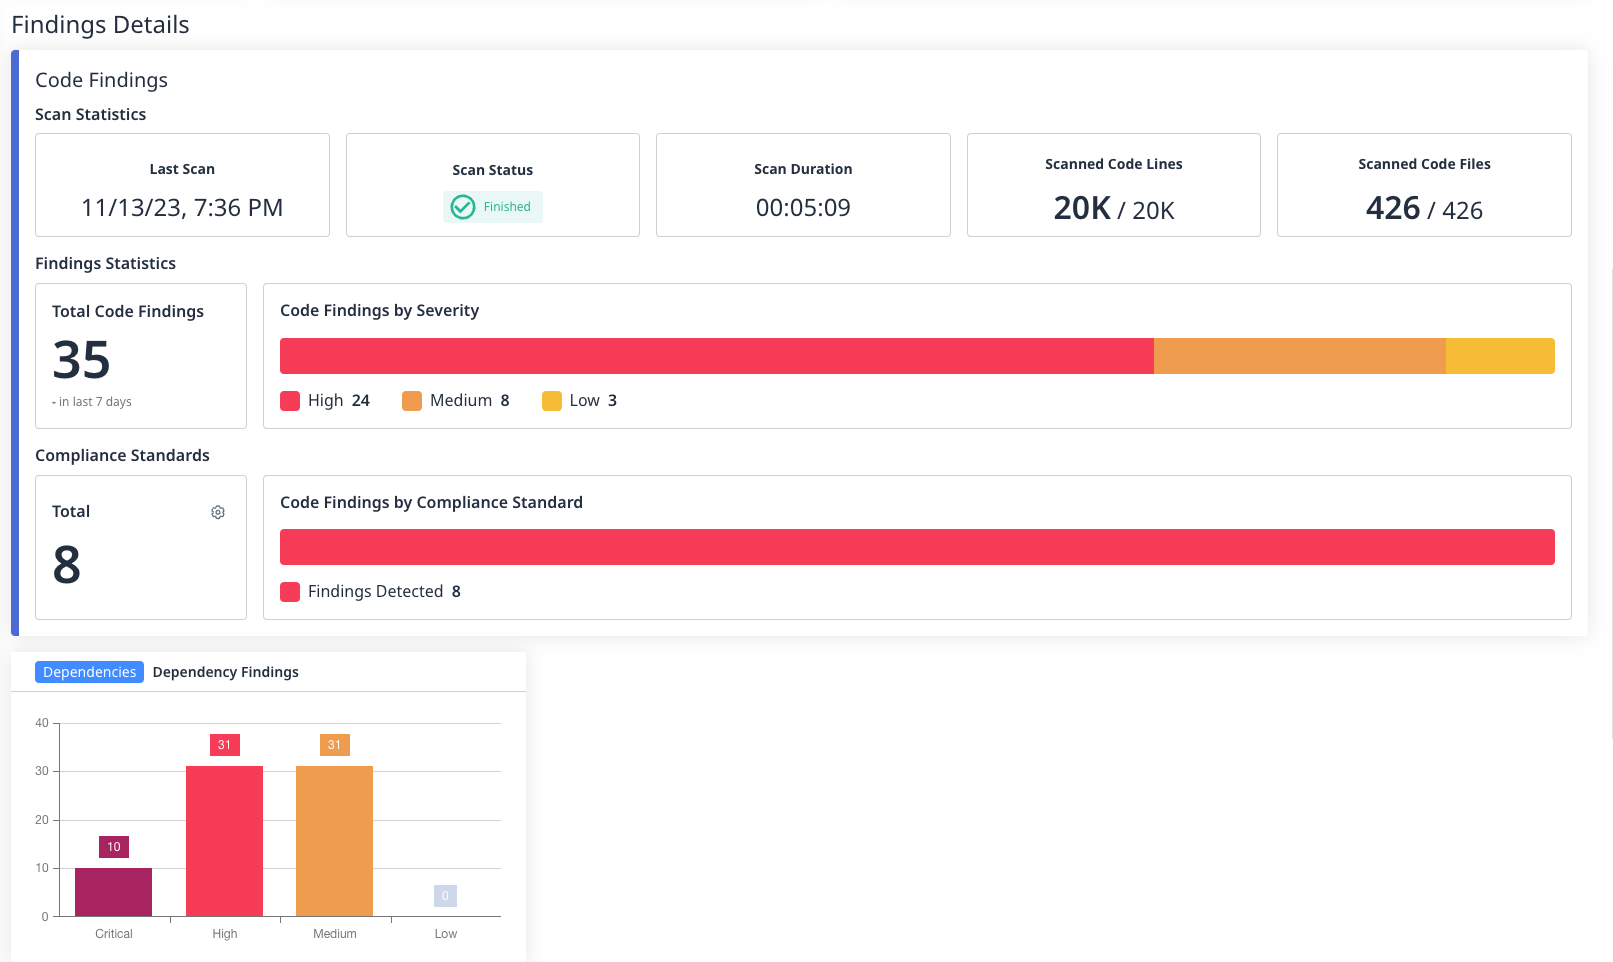
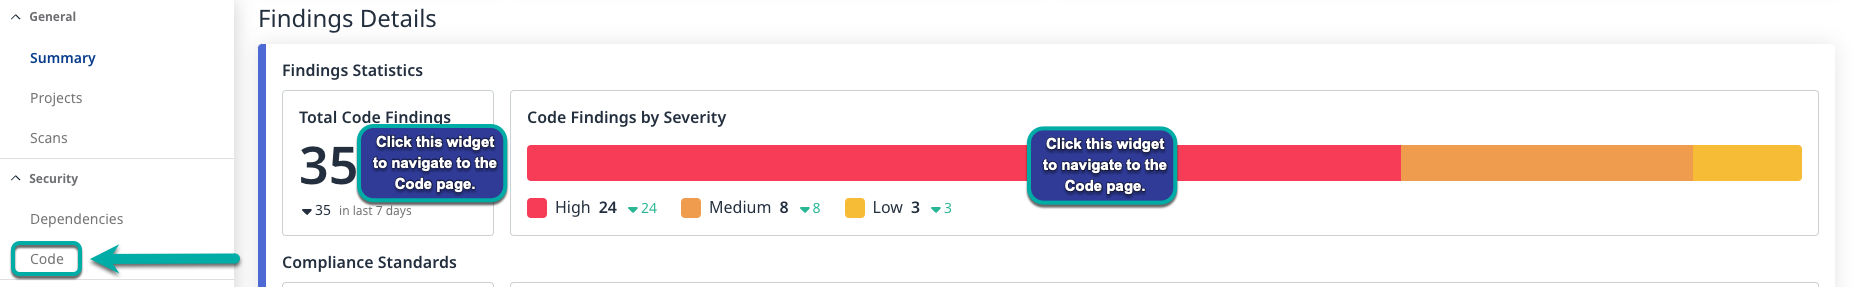
The Total Code Findings widget shows the total SAST findings within the current Application. This widget, if clicked, links to the Code page with no pre-applied filters.
-
The Code Findings by Severity widget shows the total SAST findings from all Projects within the current application by severity, Critical, High, Medium, or Low. The different severities are assigned a color. The color key is on the bottom of the widget.
1. Hover over a section of the severity graph to reveal a breakdown of the findings by CWE.
2. Click a CWE to navigate to the Code page filtered for findings matching that CWE.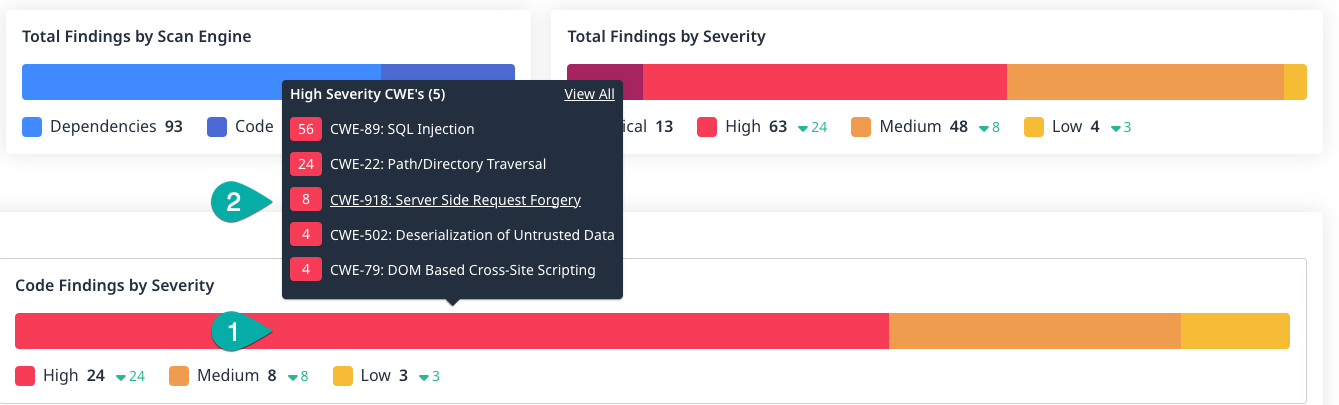
OR click a section of the severity graph to navigate to the Code page filtered for findings matching that severity.
Compliance Standards
-
The Total widget shows the total number of Compliance Standards selected for which findings are displayed.
- Click the cog in the top right corner of the widget to change which Compliance Standards findings are being displayed for.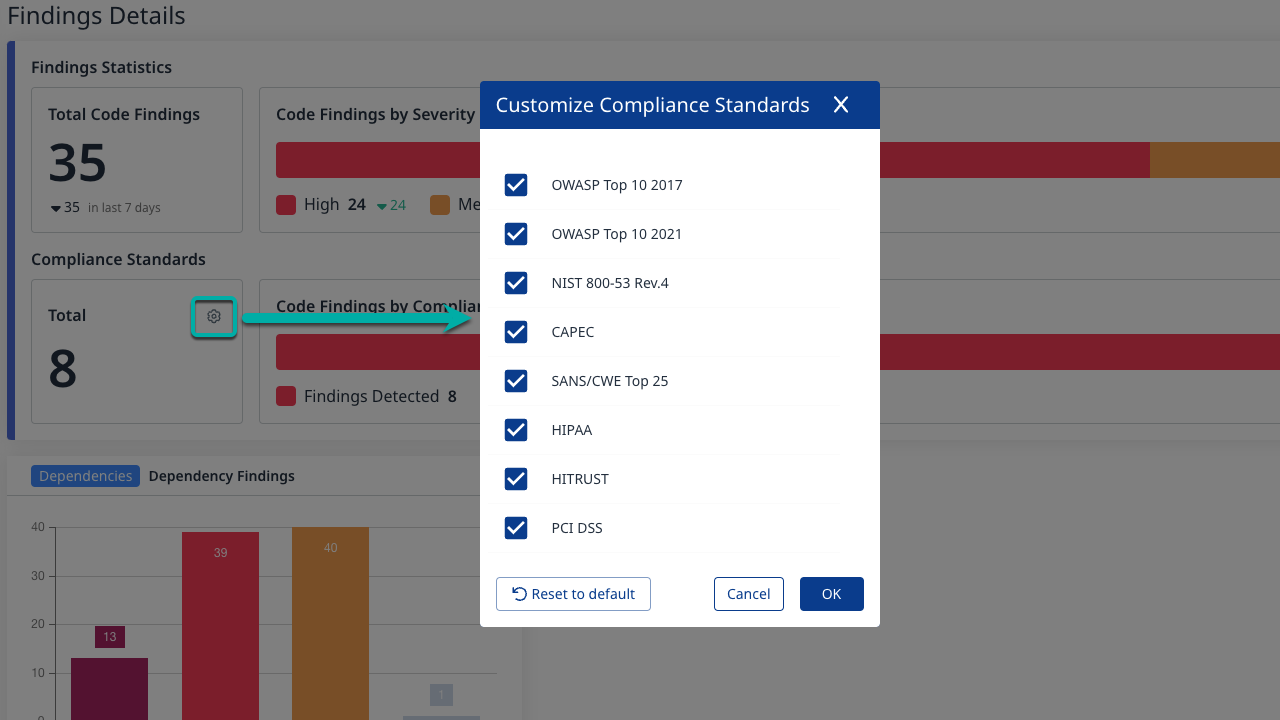
-
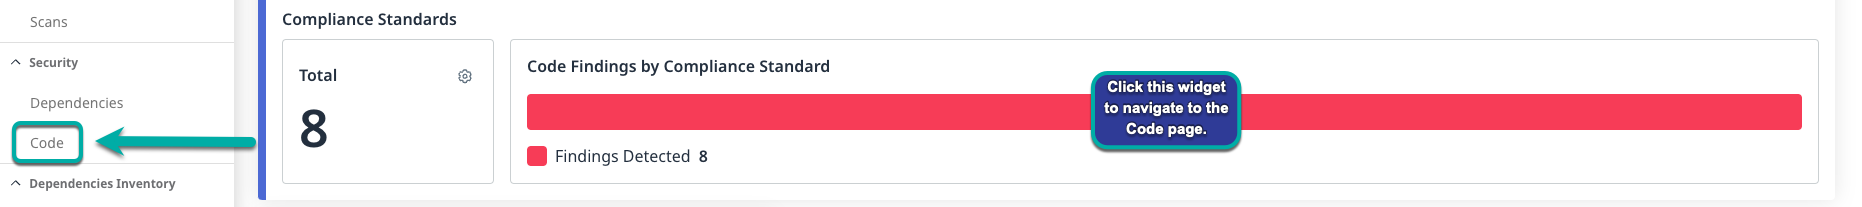
The Code Findings by Compliance Standard widget shows the total number of Compliance Standards violations detected within all the Projects within the current Application.
1. Hover over the Code Findings by Compliance Standard graph to reveal a breakdown of the findings by Compliance Standard.
2. Click a Compliance Standard to navigate to the Code page filtered for findings matching that Compliance Standard.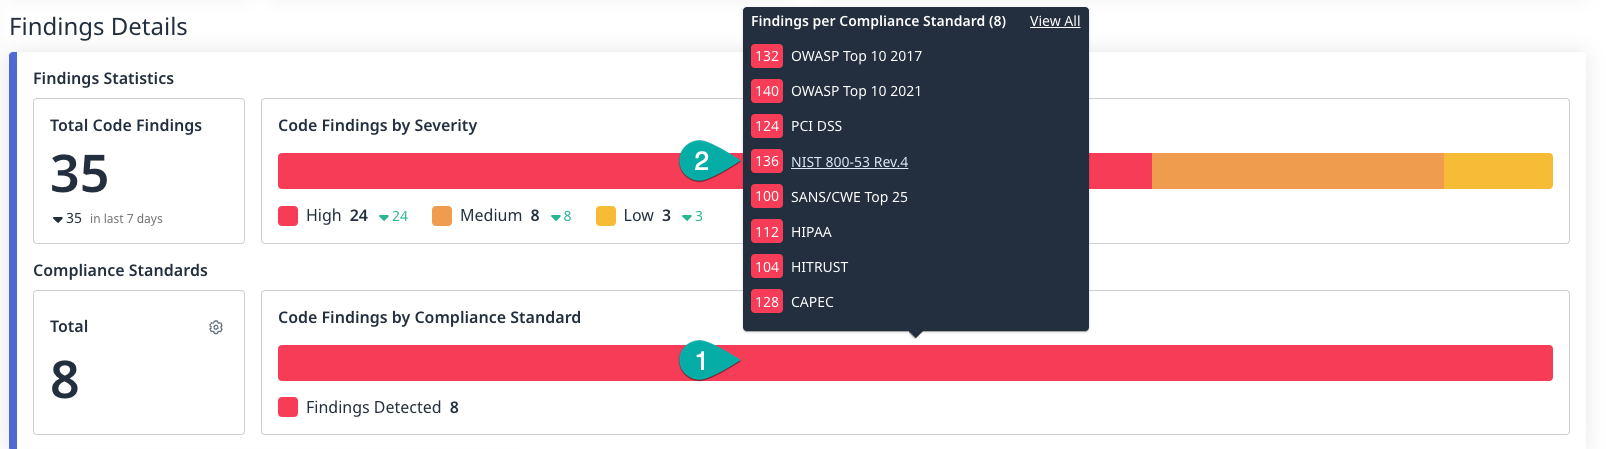
OR click a section of the Code Findings by Compliance Standard graph to navigate to the Code page filtered for findings matching only Compliance Standards.
-
The Dependencies widget shows the total number of findings for vulnerable dependencies from all Projects within the current Application by severity, Critical, High, Medium, or Low. The different severities are assigned a color.
- Click a section of the Dependency Findings severity graph to navigate to the Dependencies page filtered for findings matching that severity.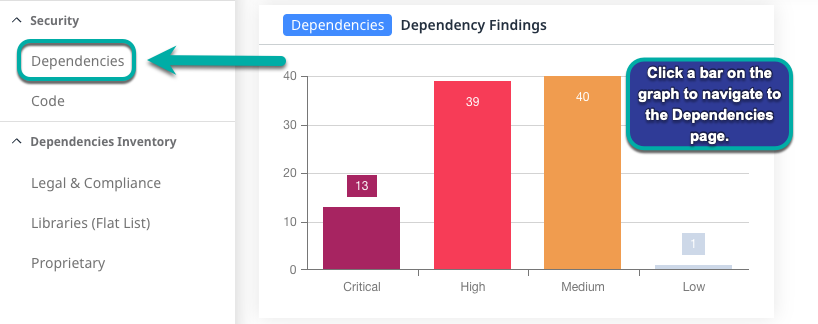
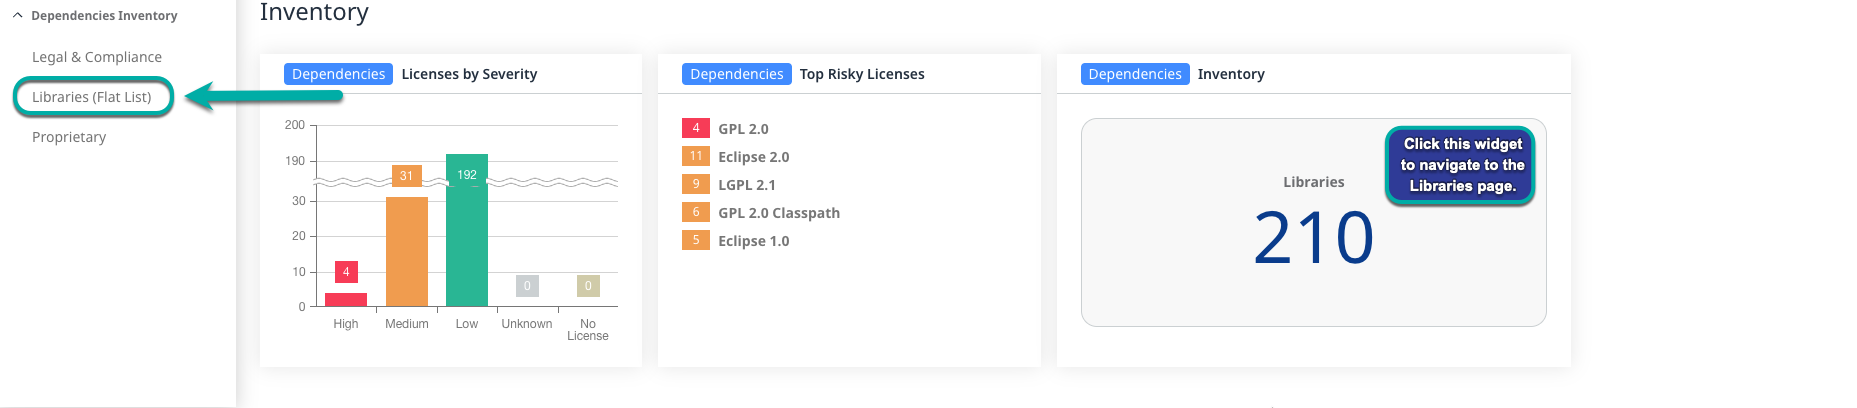
Inventory
-
The Licenses by Severity widget shows the total SCA findings of all Projects within the current application by severity, Critical, High, Medium, or Low. The different severities are assigned a color. The color key is on the bottom of the widget.
- Click a section of the Licenses by Severity graph to navigate to the Legal & Compliance page filtered for findings matching the severity. -
The Top Risky Licenses widget shows a list of Licenses associated with the highest level of risk within the Inventory of Libraries from all the Projects within the current Application.
- Click a License to navigate to the Legal & Compliance page filtered for findings matching the License.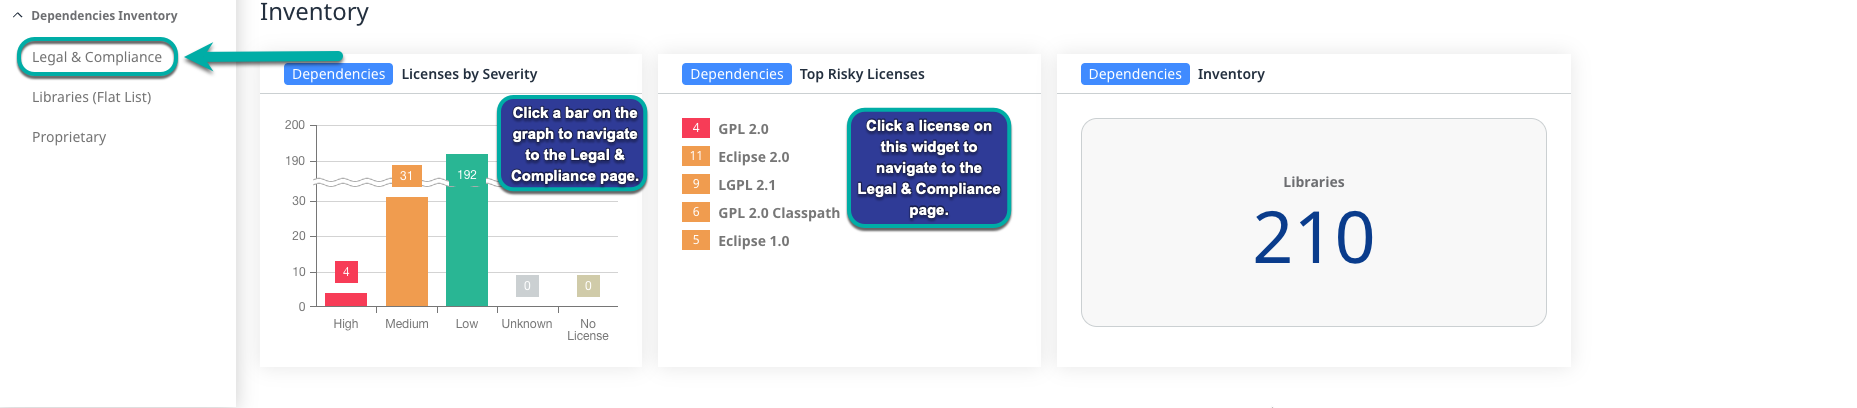
-
The Inventory widget shows the total number of open-source libraries from all the Projects within the current Application. This widget, if clicked, links to the Libraries (Flat List) page with no pre-applied filters.