Overview
The Risk Reduction Dashboard empowers security teams to cut through noise and reduce alert fatigue by revealing the security findings that truly matter. Designed exclusively for security findings, this dashboard helps users quickly spotlight what matters and take guided action by following a focused, two-step workflow:
-
Spotlight What Matters – surface the highest-risk vulnerabilities.
-
Remediate – act on actionable issues using remediation guidance.
Switching to Risk Reduction Dashboard
When you log in to the Mend AppSec Platform, the default view is the Security Dashboard, which provides an overview of your entire organization, including applications, projects, scans, and more.
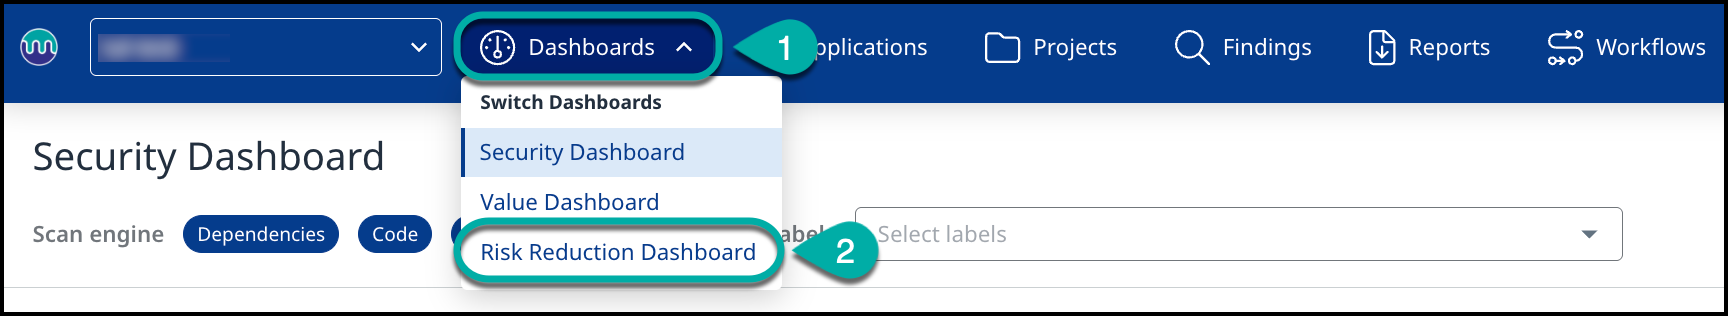
To access the Risk Reduction Dashboard, follow these steps:
-
Click on Dashboards.
-
Select Risk Reduction Dashboard.
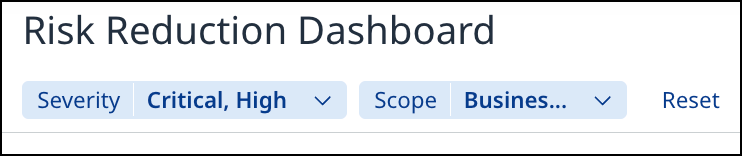
Customizing Risk Reduction View
The Value Dashboard can be filtered with various filtering options:
-
Severity - This filter applies across all dashboard metrics, enabling you to set the severity levels that matter to your organization: Critical, High, Medium, Low.
-
Scope - You can set specific scope for the dashboard data, such as Labels, Applications, or Projects.
Understanding Risk Reduction Dashboard Widgets
Access and Permissions
All users in the Mend Platform can access the Value Dashboard; however, the data displayed is permission-based and reflects only the information that a user is authorized to view.
-
Organization Admins will see aggregated data across all applications and projects they are permitted to access.
-
Application Admins and Members will have visibility into data limited to their assigned applications and projects.
This ensures that users only view data that aligns with their assigned responsibilities and access levels, maintaining security and data integrity across the organization.
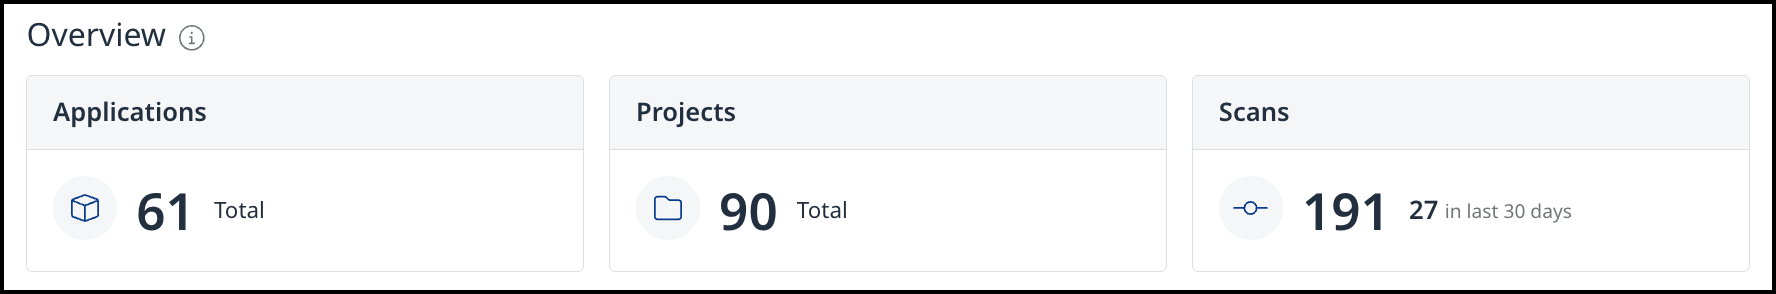
Overview
The Overview section displays key organizational indicators, including the current state of Applications and Projects, and both the current state and trends for Scans.
Security Risk Reduction Funnel
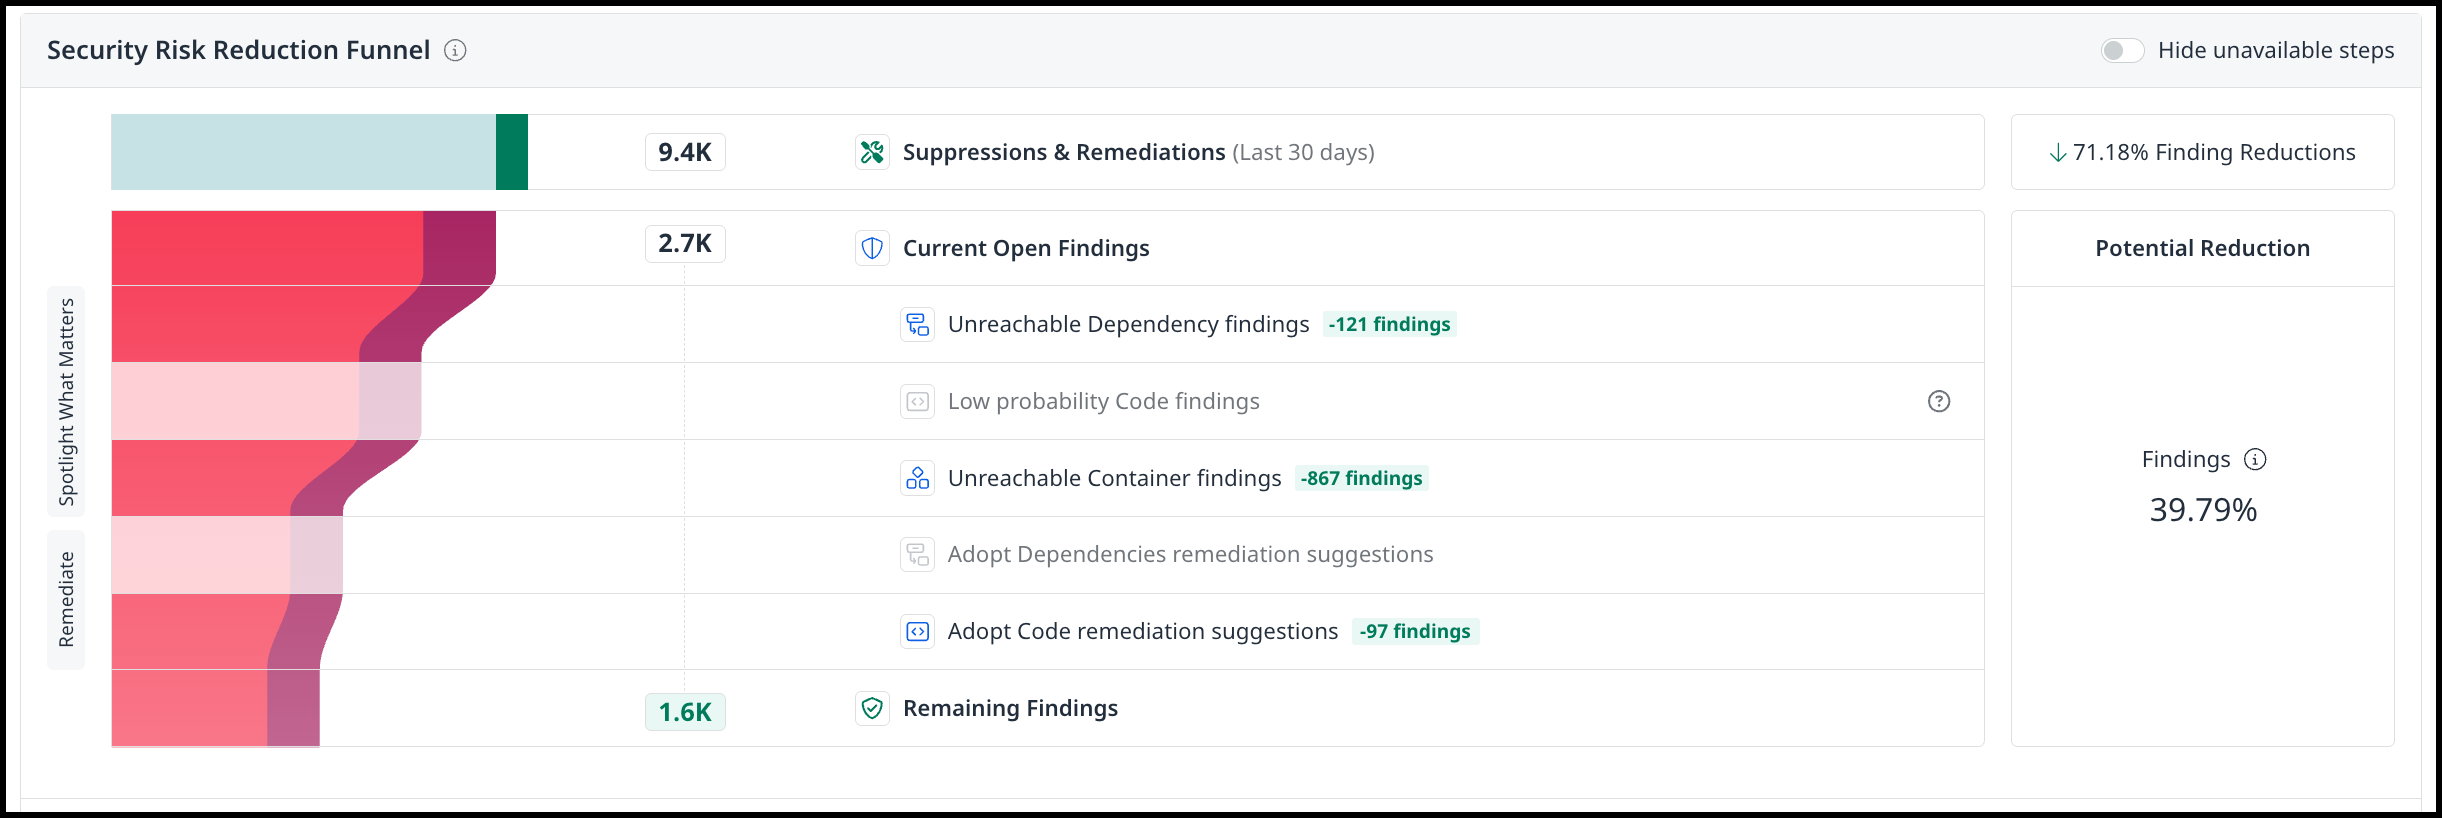
This widget shows the maximum potential reduction in security findings and remediation effort, if all available reduction steps are fully applied – such as reachability filtering and remediation suggestions. Use it to understand how much risk and effort you could eliminate by enabling and following all supported optimization steps.
If the scope of the dashboard view is for an application or project, you will be able to drill down into the findings using the ![]()
How to Read the Funnel
The funnel breaks down your findings into stages, showing both completed and potential reductions:
-
Suppressions & Remediations - The total number of findings addressed in the past 30 days through suppressions and completed remediation actions.
-
Current Open Findings - The total number of findings that remain open before additional optimization steps are applied.
-
Reduction Steps - Specific actions you can take to further reduce findings, each showing its potential impact:
-
Unreachable Dependency Findings - Findings in dependencies not reachable by application execution paths. For more information, please refer to the SCA Reachability documentation.
-
Low Probability Code Findings - Findings with a low likelihood of exploitation. For more information, please refer to the Risk Factors in Mend SAST documentation.
-
Unreachable Container Findings - Vulnerabilities in container layers that are not reachable by the application. For more information, plesae refer to the Reachability Results in the Mend Container documentation.
-
Adopt Dependency Remediation Suggestions - Suggested dependency upgrades to remove vulnerabilities. For more information, please refer to the Remediation Strategies in Mend SCA documentation.
-
Adopt Code Remediation Suggestions - Code-level fixes to eliminate vulnerabilities. For more information, please refer to the Remediate your Code (SAST) findings documentation.
-
Notes:
-
Each action is shown with the actual number of findings reduced (e.g., -121 findings).
-
When the same finding qualifies for more than one category, it will only be counted in the first applicable category and excluded from subsequent ones.
This prevents redundancy and ensures results remain clear and unambiguous.
-
The following category pairs are affected by this rule:
-
Low Probability Code Findings and Code Remediation Suggestions
-
Unreachable Dependency Findings and Dependency Remediation Suggestions
-
-
-
Remaining Findings - The number of findings left after applying all available steps.
-
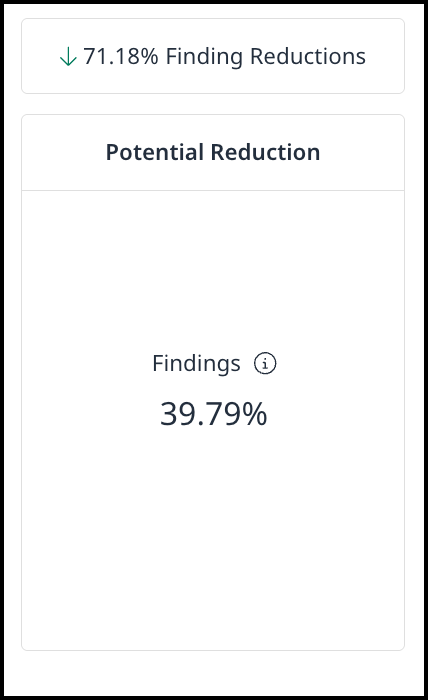
Potential Reduction - This number represents the potential percentage of total Security Findings that could be reduced if you apply all available reduction steps. It is calculated by comparing your current open findings to the remaining findings, assuming all recommended reduction steps (such as reachability analysis and remediations) are fully applied.
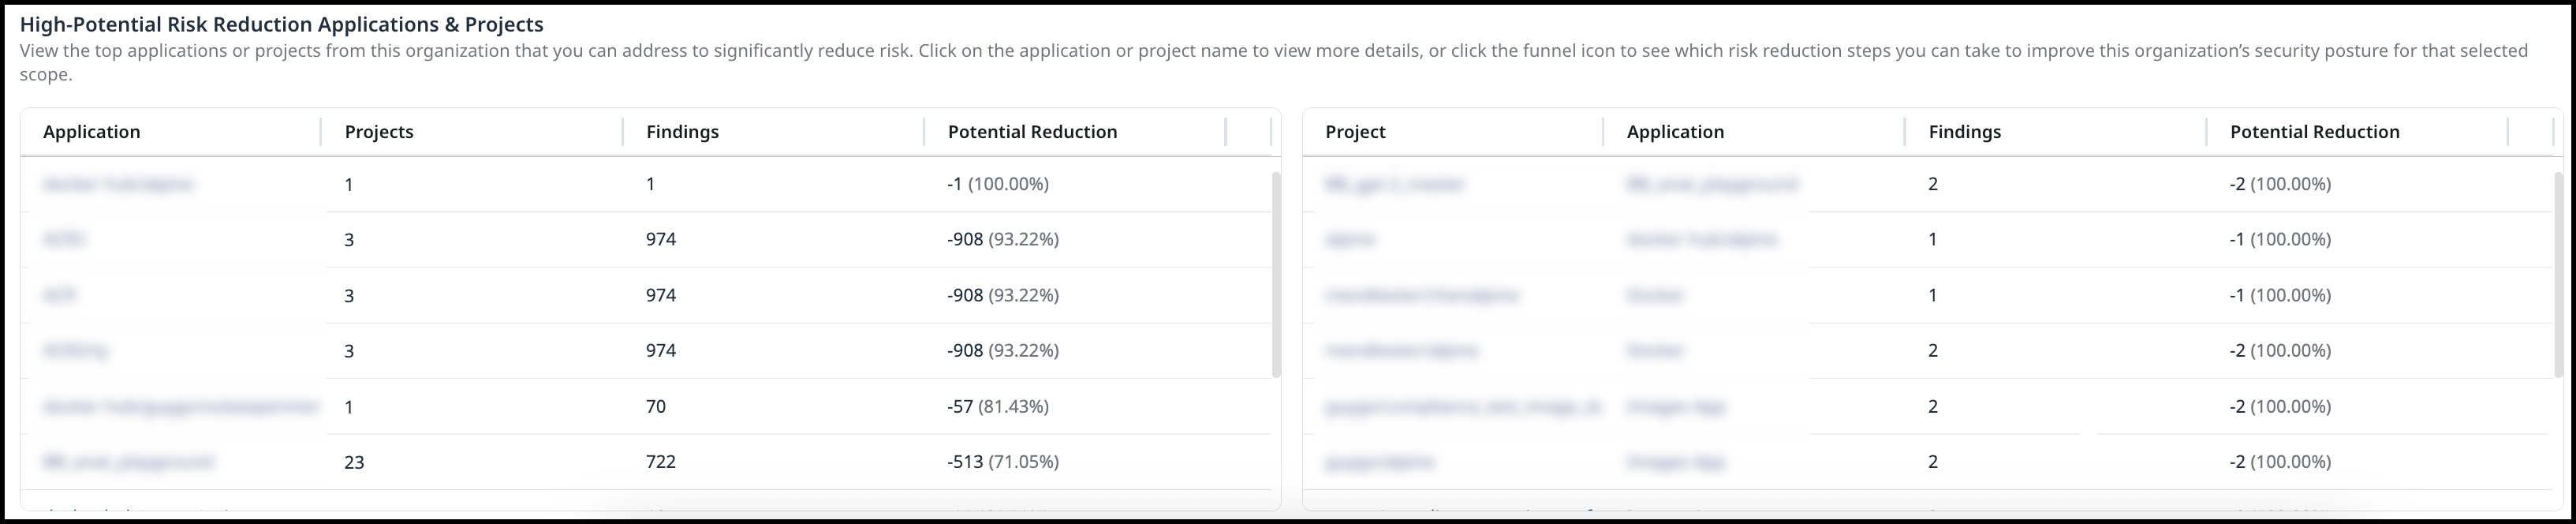
High-Potential Risk Reduction Applications & Projects
This section highlights the top applications or projects in your organization where action can significantly reduce risk. Select an application or project name to view detailed information, or click the funnel icon to explore specific risk reduction steps that can improve the organization’s security posture for the selected scope.