This article explains how to check the webhooks traffic for self-hosted Developer Integrations: GitHub Enterprise and GitLab Server. The webhook traffic needs to be checked if you are triggering scans but do not see anything logged in the controller log (no webhooks are intercepted).
Finding Webhooks Traffic in GitHub Enterprise:
-
Trigger a scan to generate webhooks traffic. To do this, update the .whitesource file in any of the onboarded repositories by simply adding a blank line to the file and committing it to the branch
-
While logged into GitHub Enterprise navigate to Settings > Developer settings > GitHub Apps
-
Click “Edit” on the Mend for GitHub Enterprise app
-
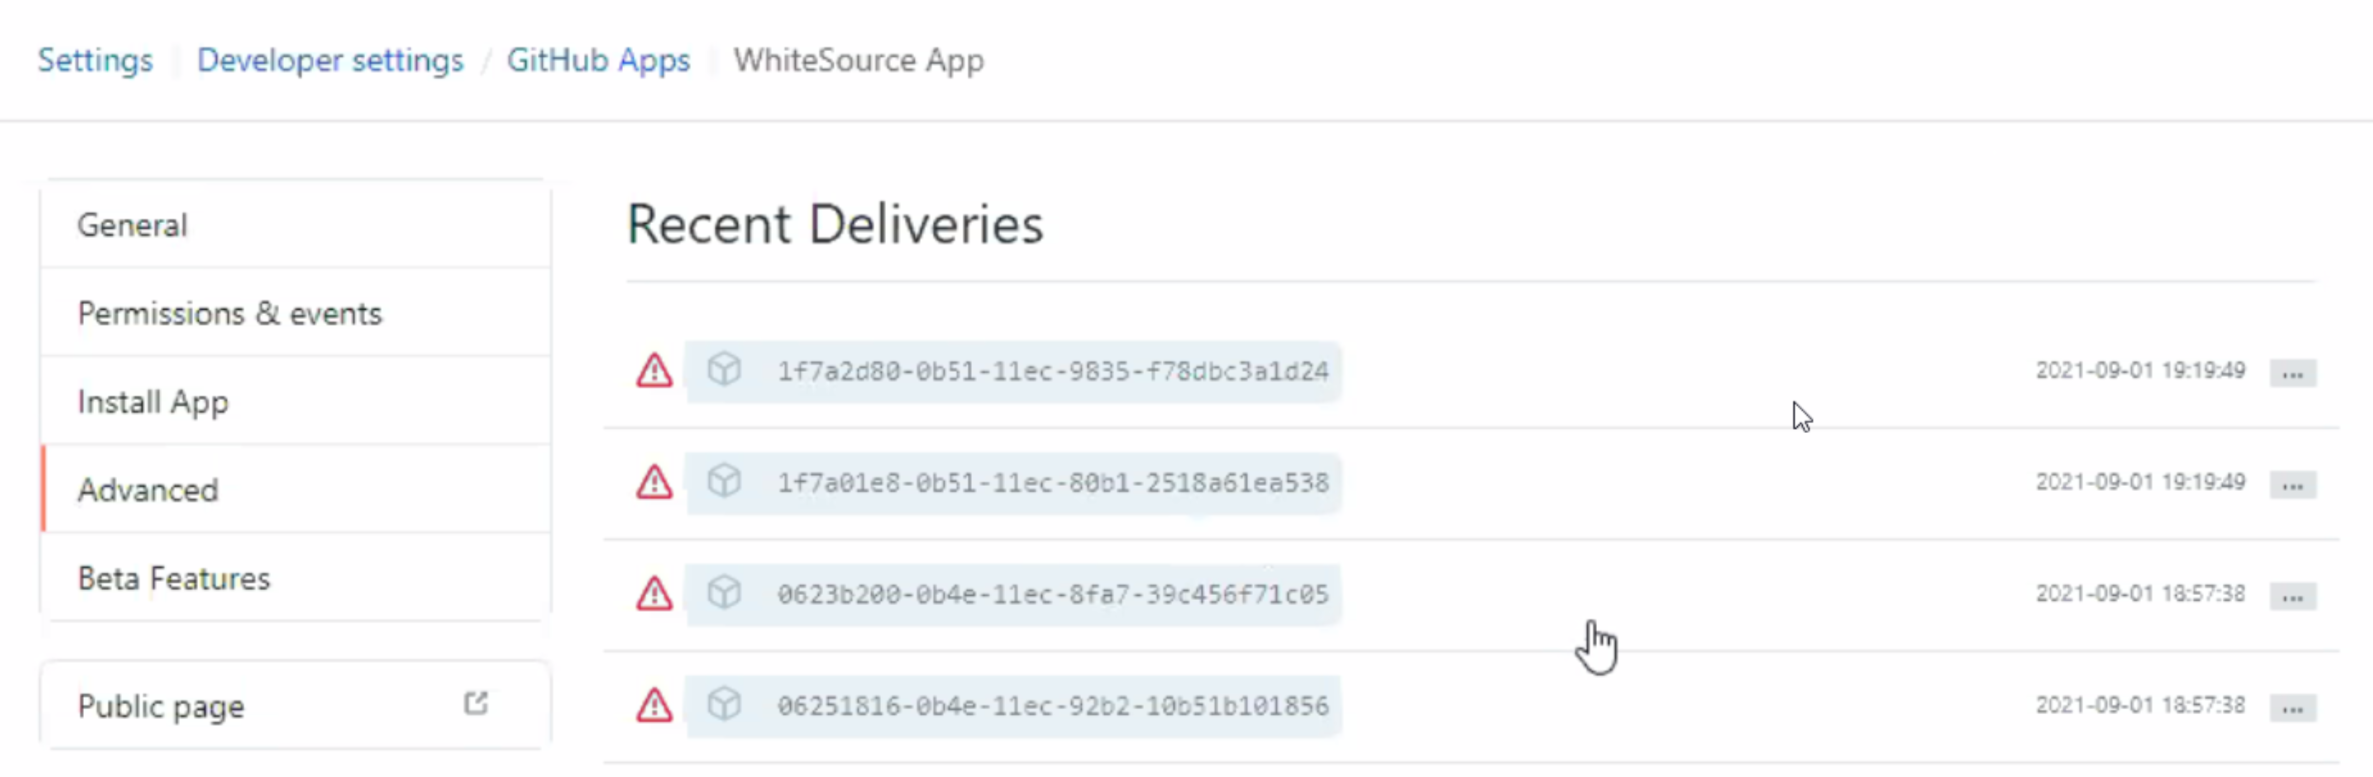
Select the “Advanced” tab located in the left-hand side menu
-
Analyze the webhooks under the “Recent Deliveries” section as shown in the screenshot below:
Finding Webhooks Traffic in GitLab:
-
Trigger a scan to generate webhooks traffic. To do this, update the .whitesource file in any of the onboarded repositories by simply adding a blank line to the file and committing it to the branch
-
While logged into GitLab, navigate to Menu > Admin > System Hooks
-
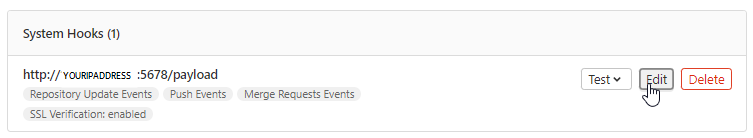
Click “Edit” on the URL you use for your GitLab integration. This is located under the “System Hooks” section at the bottom of the screen
-
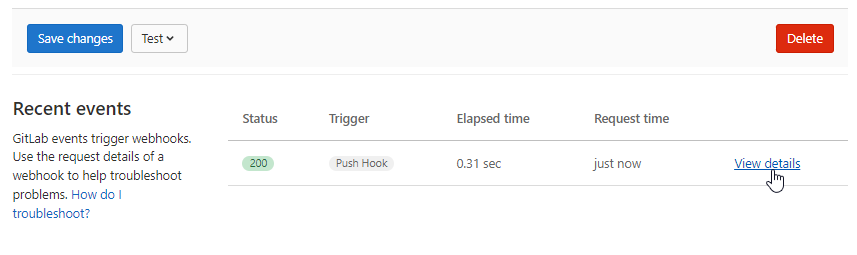
If you see the "No webhook events" message after clicking on “Edit”, please go back to step 1 and trigger a scan:
5. -
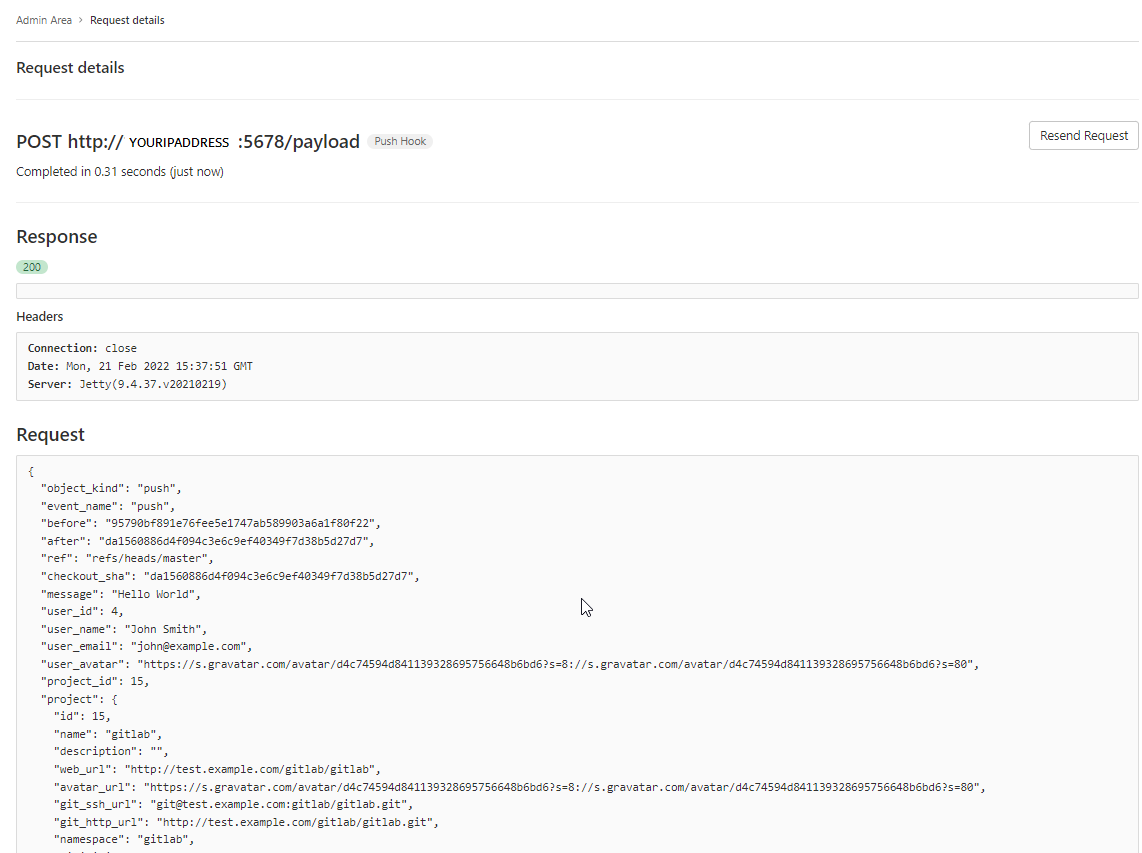
To see the details of events, click on the “View details” hyperlink in the “Recent events” section:
-
Analyze the details of the request as indicated in the screenshot below: