Overview
This dashboard provides a clear view of the Kubernetes resources along with the ability to filter, sort, and view the vulnerabilities per pod in the cluster. It includes the following scope views:
-
Clusters
-
Pods (Default)
-
Images
You can search for a specific resource by entering its name or a portion of its name in the Filter field. To remove the filter settings, click the Reset View link.
Vulnerability Distribution
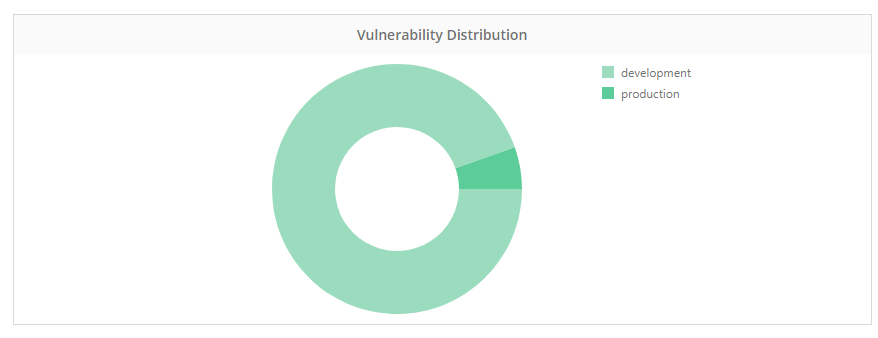
This panel displays the vulnerability distribution for the selected scope, and displays the top 10 slices with the most vulnerabilities.
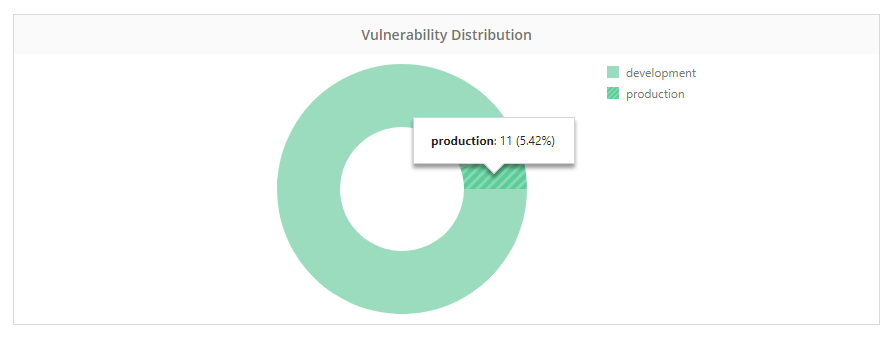
Drilling Down
Clicking on a specific slice displays the number of vulnerabilities in the selected slice and its percentage in relation to all the vulnerabilities that were found in the selected scope. This action also populates the vulnerabilities table with the relevant issues.

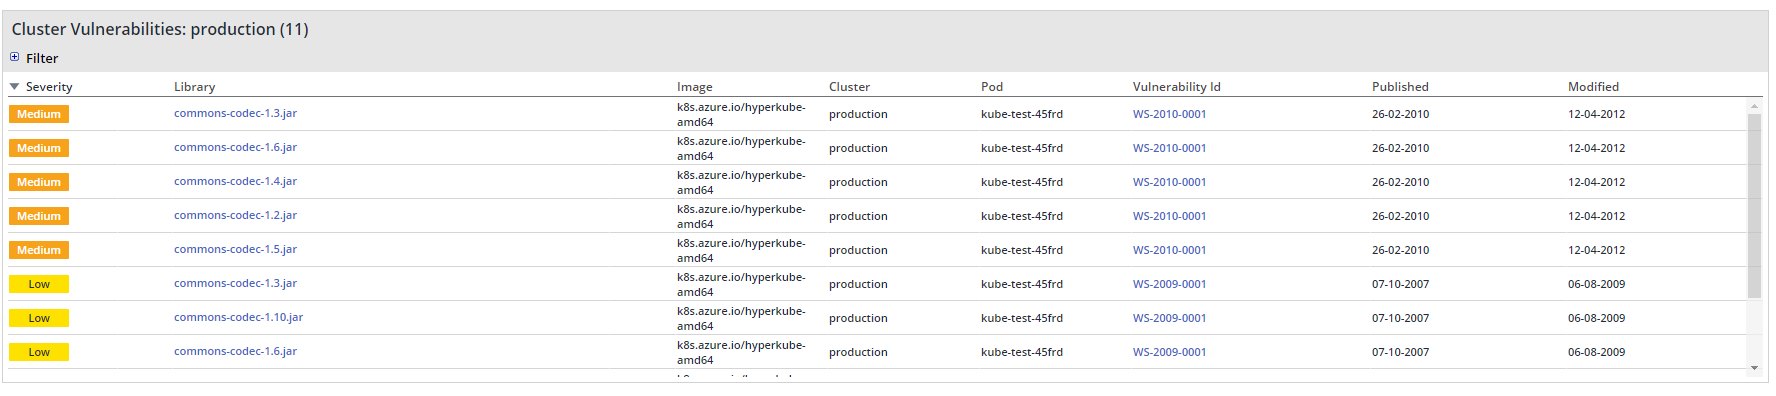
The vulnerabilities table displays the following columns:
-
Severity: The severity of a vulnerability is between a range of 0 to 10, and has three severity levels for CVSS2 and five severity levels for CVSS3.
-
Library: The 'Library' column provides information regarding the library that was detected as 'vulnerable'. Clicking on the library name navigates you to the library details.
-
Image: The image where the vulnerability was found
-
Cluster: The image where the vulnerability was found
-
Pod: The pod where the vulnerability was found
-
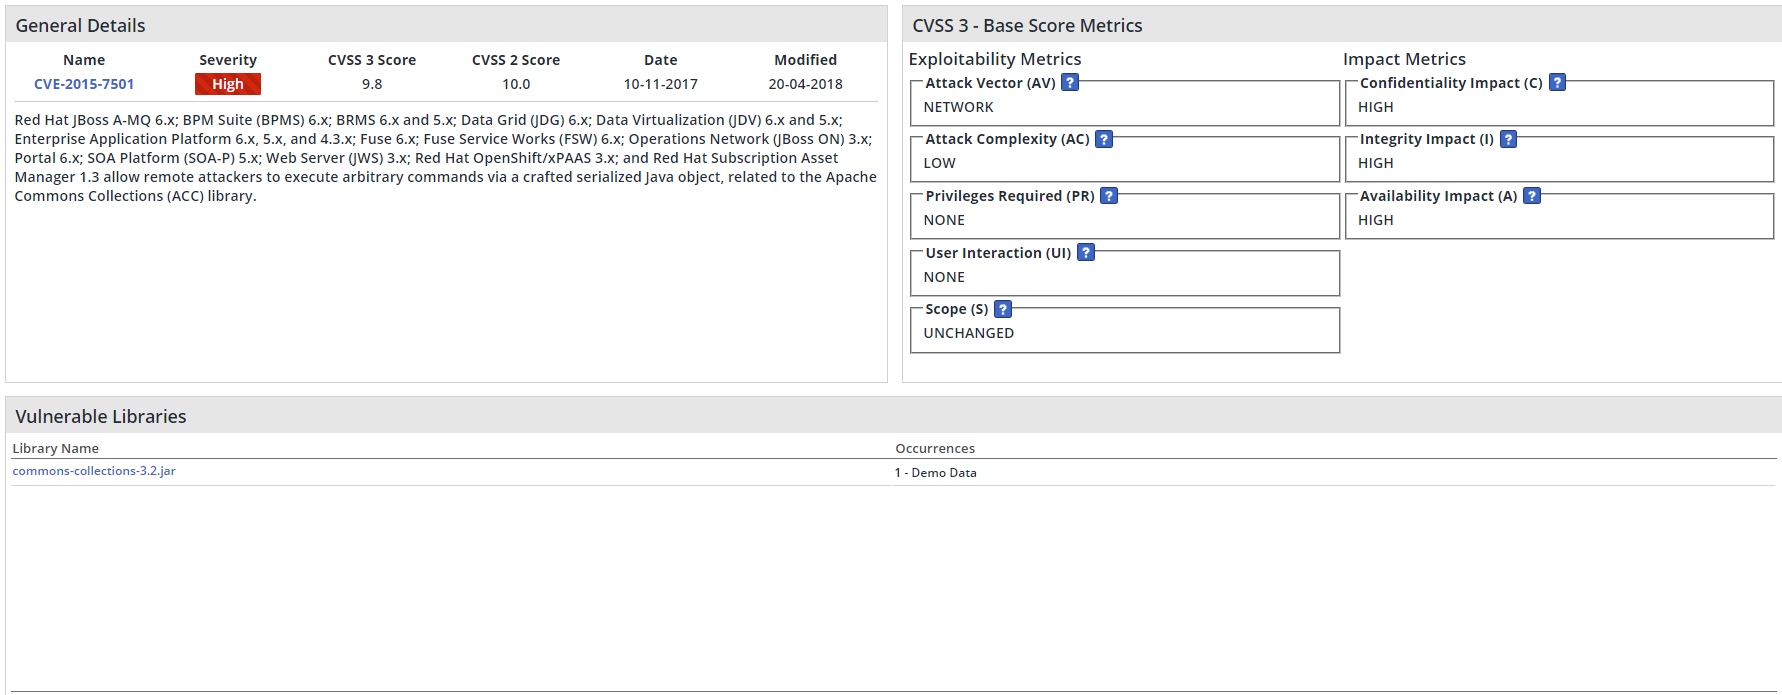
Vulnerability ID: The vulnerability identifier, which can consist of two vulnerability types: 'CVE' and 'WS' (see definitions on Working with Vulnerabilities). Clicking the Vulnerability ID link displays the vulnerability details, a link to MITRE source, the CVSS3 base score metrics (when available), a link to the library's CVE web page (when relevant) and provides a fix (if it exists):
-
Published: The published date of the vulnerability.
-
Modified: The modified date of the vulnerability.
Vulnerability Severity
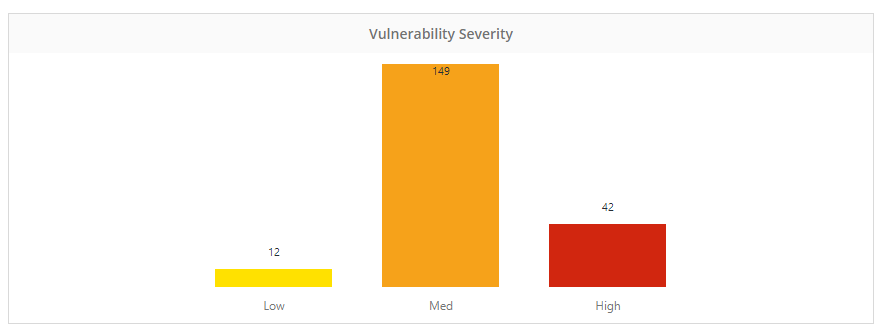
The severity of the vulnerabilities is displayed according to the ratings in the following table:
|
CVSS v2.0 Ratings |
CVSS v3.0 Ratings |
||
|
Severity |
Base Score Range |
Severity |
Base Score Range |
|
|
|
None |
0.0 |
|
Low |
0.0-3.9 |
Low |
0.1-3.9 |
|
Medium |
4.0-6.9 |
Medium |
4.0-6.9 |
|
High |
7.0-10.0 |
High |
7.0-8.9 |
|
|
|
Critical |
9.0-10.0 |