View your Mend Advise Code for JetBrains IDEs scan results
Deprecation Notice: Mend Advise Code for JETBRAINS is no longer maintained or updated. It is planned to be superseded by a new plugin in May 2026 and deprecated soonthereaft
Overview
Mend Advise Code provides various options to review the scan results of your projects when using supported JetBrains IDEs, such as IntelliJ IDEA, PyCharm, and WebStorm.
Getting it done
Mend Advise Code results - JetBrains IDE in-app
Within the JetBrains IDE UI, navigate to the Mend security findings tab to review your Mend Advise Code results:
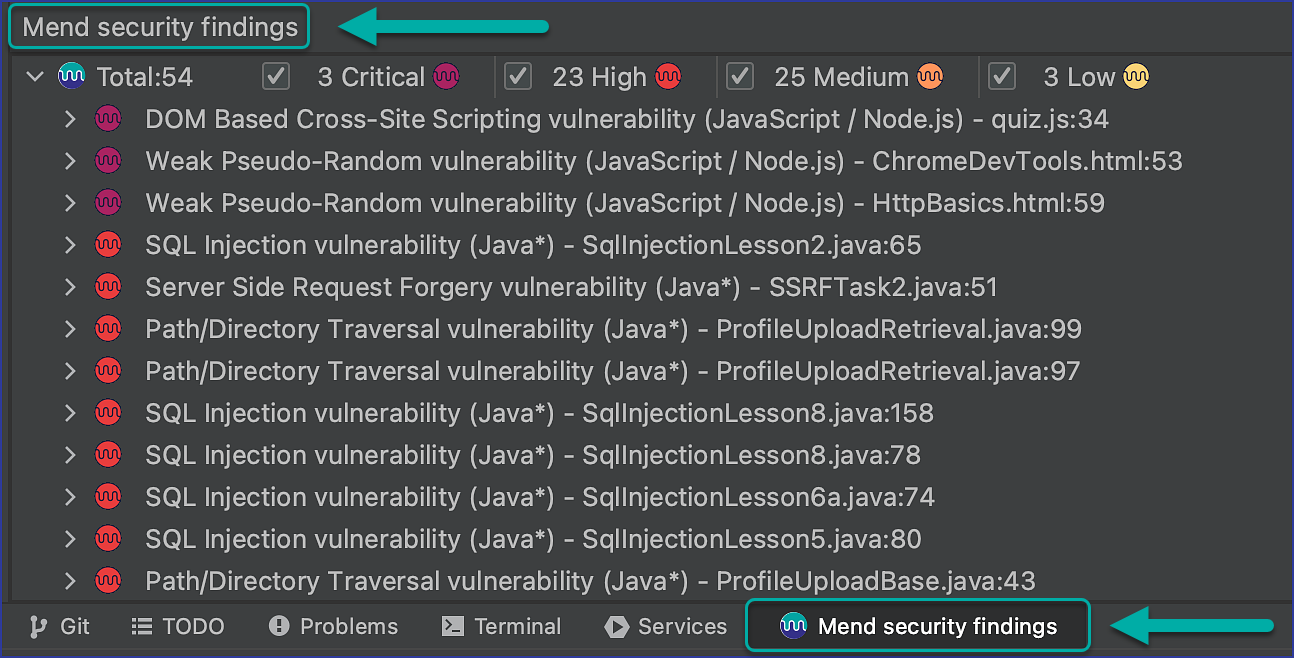
JetBrains IDE in-app - Result sorting
Scan findings are sorted by severity; Critical, High, Medium, and Low. You can use the filter buttons to focus on specific findings within these severity levels:

JetBrains IDE in-app - Data flows
For each Mend Advise Code finding, it is possible to traverse the data flow leading up to the vulnerability. To do this:
Expand the finding in the Mend security findings tab.
Click on any step of the data flow to jump to the relevant code line in the code view pane:
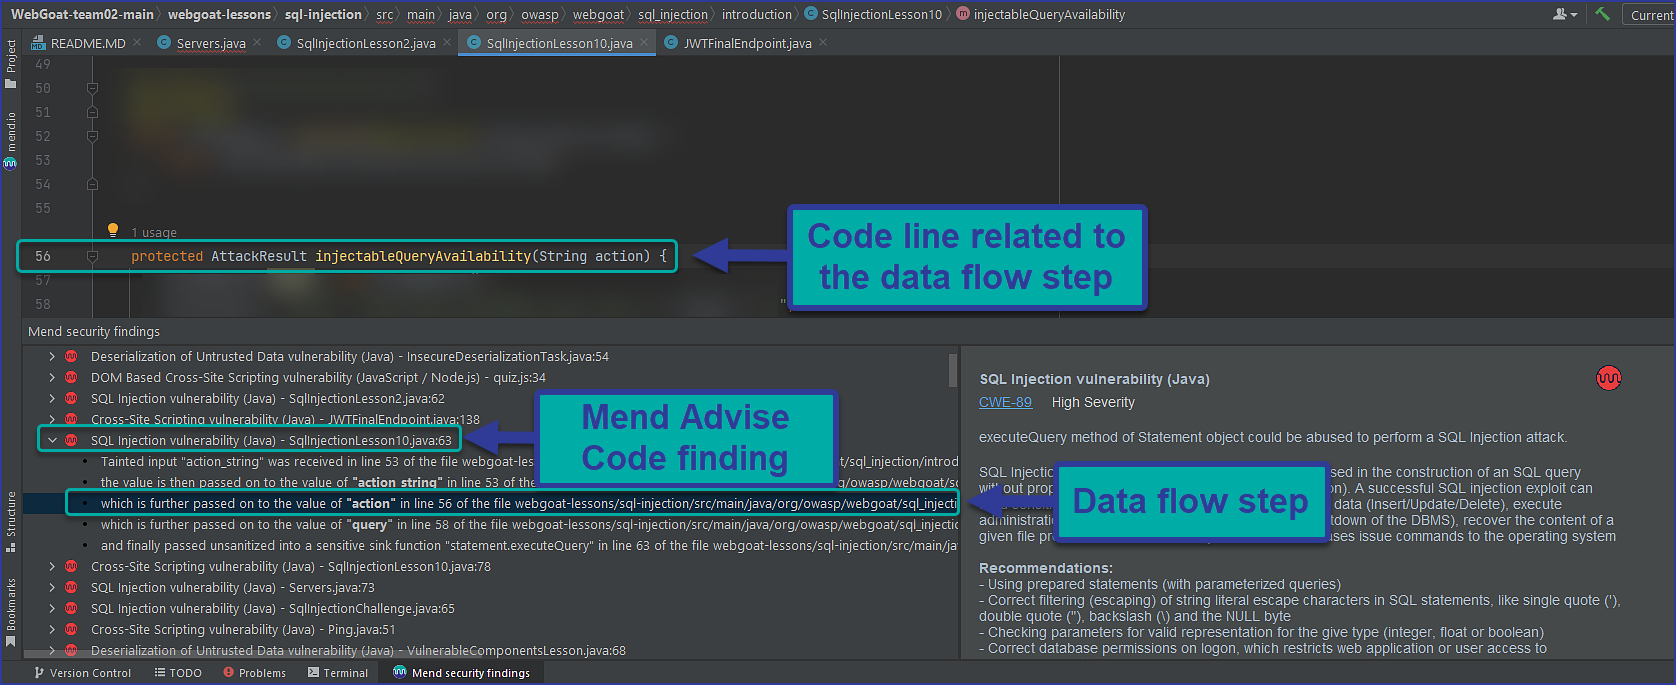
Some findings may have multiple data flows. In this case, the data flows will still be listed under the finding, however, they can be expanded separately. Every data flow will always end with the code line to which the finding is attributed, also known as the sink.
JetBrains IDE in-app - CWEs and recommendations
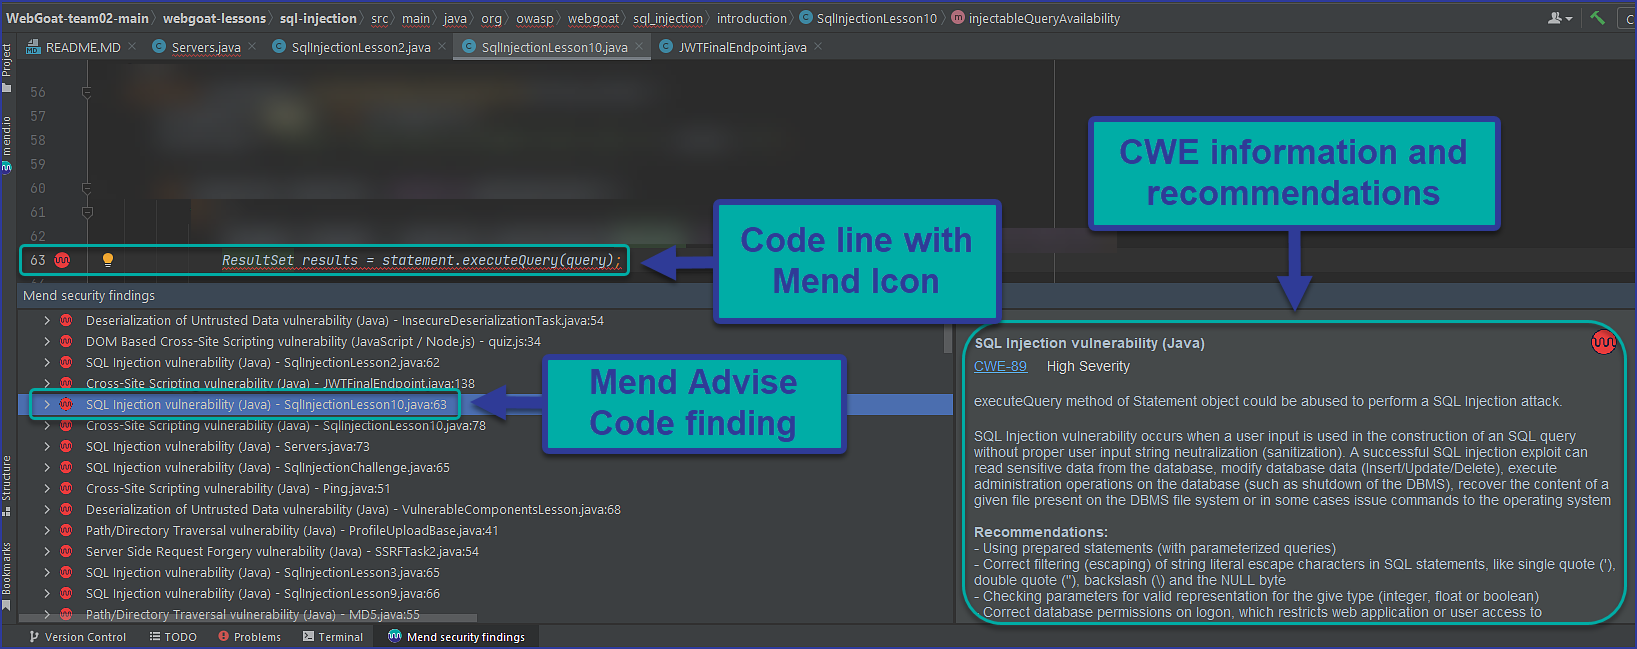
Click on a Mend Advise Code finding to jump to the relevant code line. An icon will mark the specific line and the bottom pane will show the details of the code issue, including a link to the official CWE page and fix recommendation(s). Hovering over the code line of a security finding in the code window will present the same information in a tooltip.
Mend Advise Code results - Mend SAST Application
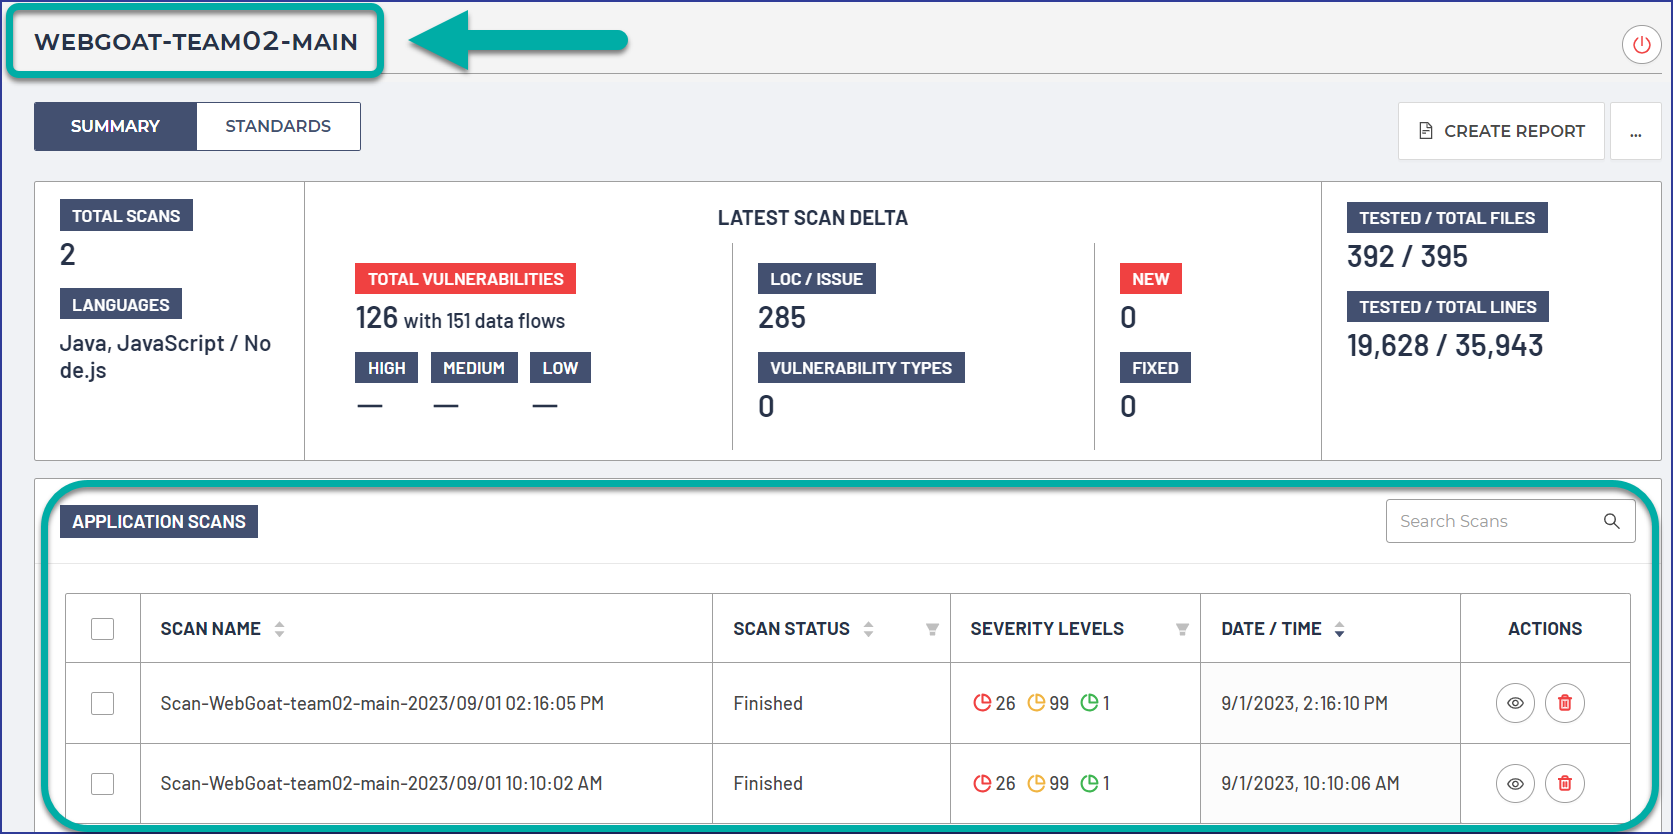
Mend Advise Code results are populated within the Mend SAST Application UI of the organization you authenticated to during installation. The Application name will be the name of your project in JetBrains IDE, and you can review the Mend Advise Code scans that have been completed on your JetBrains IDE project within the Application Scans panel:
Mend Advise Code results - Export scan findings
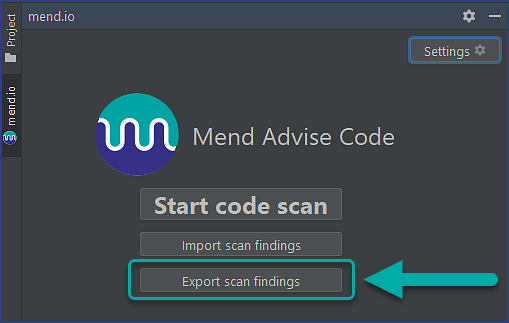
You can export your Mend Advise Code scan findings via the Mend Advise Code plugin panel → Export scan findings button:
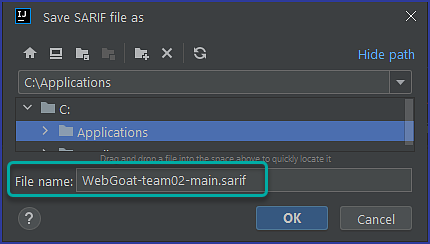
A pop-up window will appear, allowing you to download your SARIF-formatted Mend Advise Code report:
Mend Advise Code results - Import scan findings
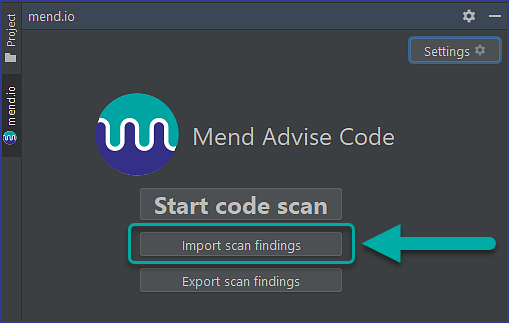
From the Mend Advise Code plugin panel, click on the Import scan findings button to import previous scan findings from a Mend-generated SARIF file that is saved on your machine:
Reference
Mend Advise Code for JetBrains IDEs logging
You can view the scan logs of Mend Advise Code for JetBrains IDEs via:
Mend Advise Code plugin → Settings page → View last scan log: This will download the log file (File Format:
<Project-Name_Date-Time-of-scan.log) of the latest scan. In case assistance from Mend Support is needed, this file also contains the Support token at the end of the log which is helpful in technical investigations.The “log” directory: The “log” directory is typically found in the following locations:
For IntelliJ IDEA:\.mend\ide\intellij\log
PyCharm:\.mend\ide\pycharm\log
Webstorm:\.mend\ide\webstorm\log
Within the “log” directory, you can review the log files of Mend Advise Code scans that have occurred across multiple projects, not just the latest scan completed. Each project will have its own folder under the “log” directory.For native IDE behaviors, JetBrains IDEs provide their logs via the idea.log file. This file can be accessed via JetBrains IDE’s UI:
For Windows: Help → Show Log in Explorer
For macOS: Help → Show Log in Finder
