Note: Mend AI data are not included in the Value Dashboard and must be consumed separately via the AI Security Dashboard.
Overview
The Value Dashboard is designed to help CISOs and security teams track the impact of Mend.io’s security solutions. It provides insights into how Mend.io contributes to improved security posture by analyzing key metrics such as findings, remediation status, and Mean Time to Remediate (MTTR) to track progress, identify areas for improvement, and optimize security workflows.
With powerful filtering options, you can customize the view based on scan engines, severity levels, labels, and time frames, ensuring focus on the most relevant security insights. By leveraging the Mend Value Dashboard, organizations can make data-driven decisions, streamline remediation efforts, and continuously improve their security operations.
Switching to Value Dashboard
When you log in to the Mend AppSec Platform, the default view is the Security Dashboard, which provides an overview of your entire organization, including applications, projects, scans, and more.
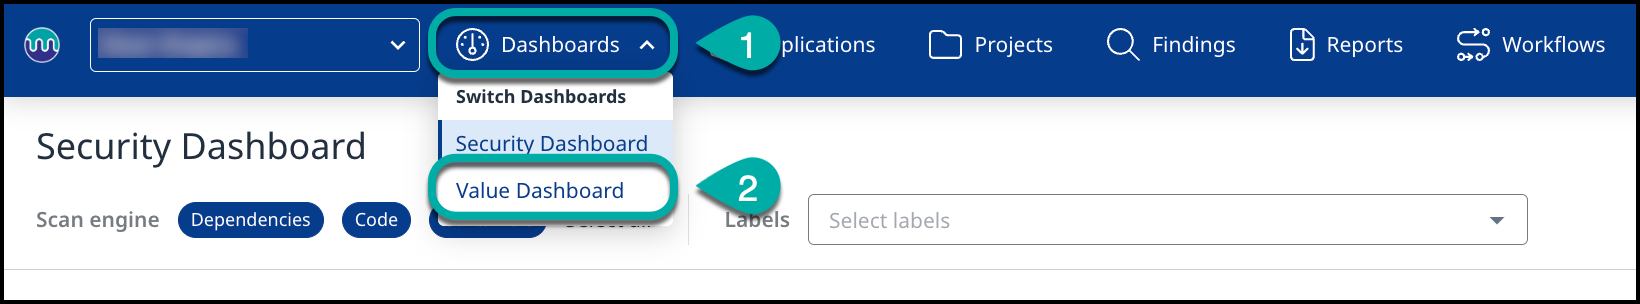
To access the Value Dashboard, follow these steps:
-
Click on Dashboards.
-
Select Value Dashboard.
Customizing Value Dashboard View
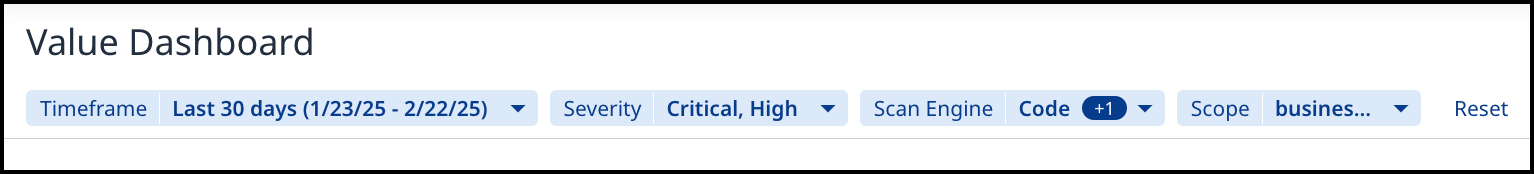
The Value Dashboard can be filtered with various filtering options:
-
Timeframe - Select a timeframe for analysis using the following options:
-
Quick Select - Last 7, 30, 60, 90 days
-
By Month
-
By Quarter
-
-
Severity - This filter applies across all dashboard metrics, enabling you to set the severity levels that matter to your organization: Critical, High, Medium, Low.
-
Scan Engine - Select which scan engines to include in the dashboard data.
-
Scope - You can set specific scope for the dashboard data, such as Labels, Applications, or Projects.
Understanding Value Dashboard Widgets
Access and Permissions
All users in the Mend Platform can access the Value Dashboard; however, the data displayed is permission-based and reflects only the information that a user is authorized to view.
-
Organization Admins will see aggregated data across all applications and projects they are permitted to access.
-
Application Admins and Members will have visibility into data limited to their assigned applications and projects.
This ensures that users only view data that aligns with their assigned responsibilities and access levels, maintaining security and data integrity across the organization.
Overview
The Overview section provides the top organization indicators including current state and trends for Applications, Projects, and Scans.
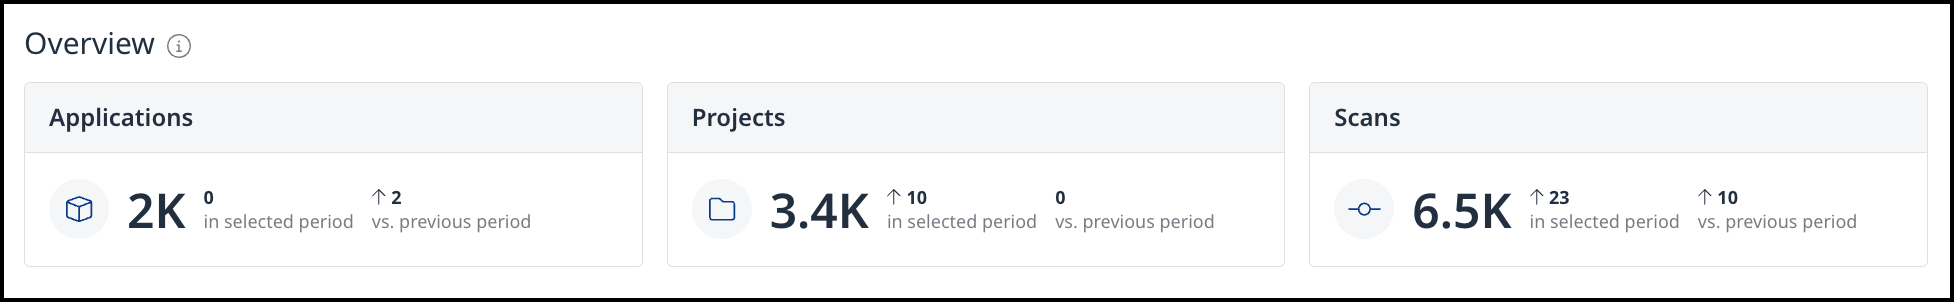
Note: The “selected period” refers to the timeframe chosen by the user to analyze trends and metrics within the dashboard, while the “previous period” represents the equivalent timeframe before the selected period. This comparison helps you track changes, improvements, or regressions over time, providing context to the displayed data and enabling better trend analysis.
Remediation Overview
The Remediation Overview section provides a view of key performance indicators and metrics related to remediations within your organization:
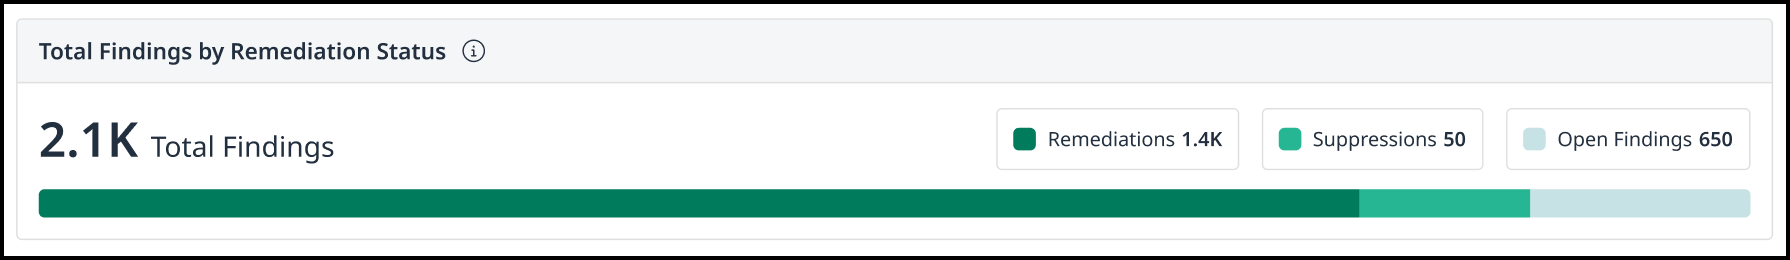
Total Findings by Remediation Status
This widget shows a breakdown of total findings by remediation status. You can view the number of remediated findings, the findings that were suppressed, and the total count of open findings.
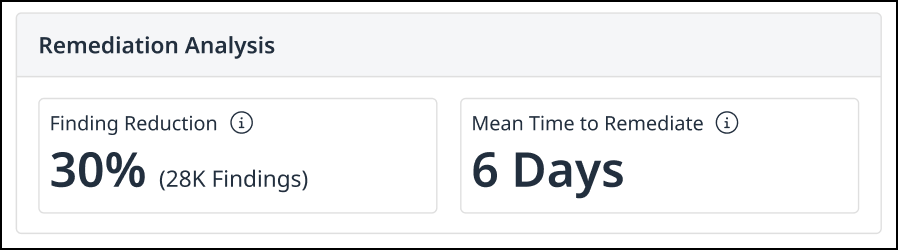
Remediation Analysis
Finding Reduction
This widget provides a comprehensive measure of security risk reduction by displaying the total number of findings reduced over the selected period, factoring in both remediated and suppressed findings.
Mean Time to Remediate
This widget measures how quickly your teams resolve findings by displaying the mean remediation time (in days) over the selected period, a comparison of MTTR across different severity levels to highlight response effectiveness for critical vs. low-priority issues, and trends in remediation speed to identify potential delays in security response within the organization.
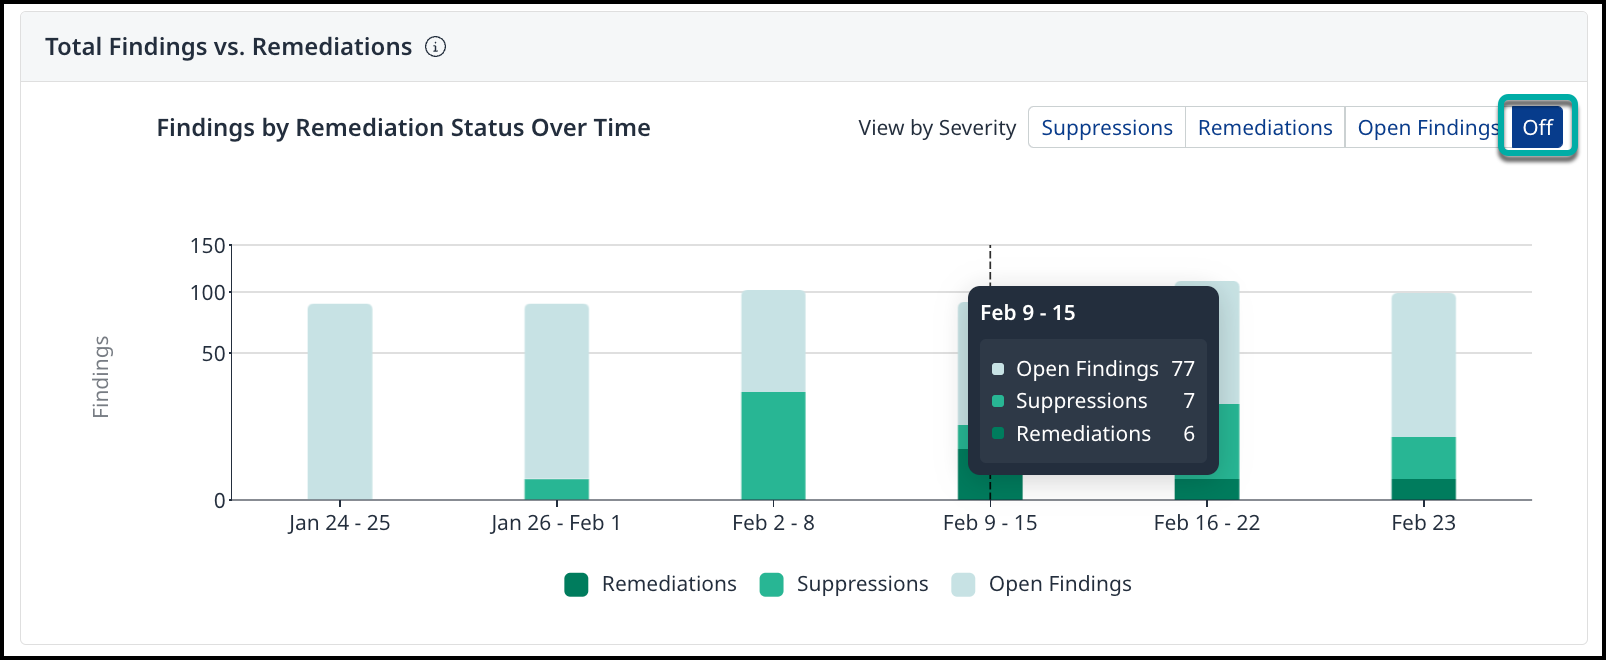
Total Findings vs. Remediations
This section provides a comprehensive view of findings and remediation efforts over time, helping you track security trends effectively. You can choose to display all findings by remediation status (Remediations, Suppressions, and Open Findings) or drill down into each category by severity, enabling a more detailed assessment of risk levels and remediation progress.
The toggle in the top-right panel allows you to switch between several views:
-
Findings by Remediation Status (Toggle = Off)
-
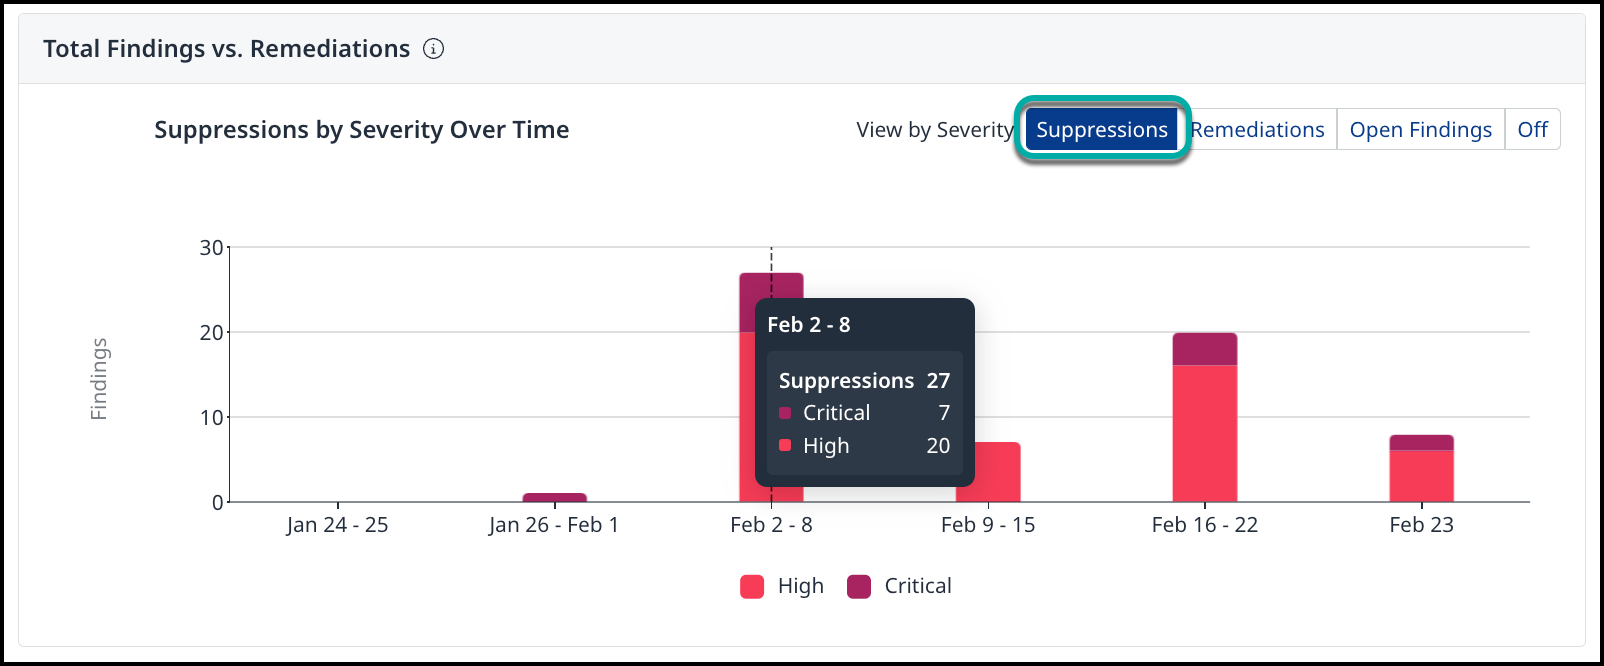
Suppressions by Severity (Toggle = Suppressions)
-
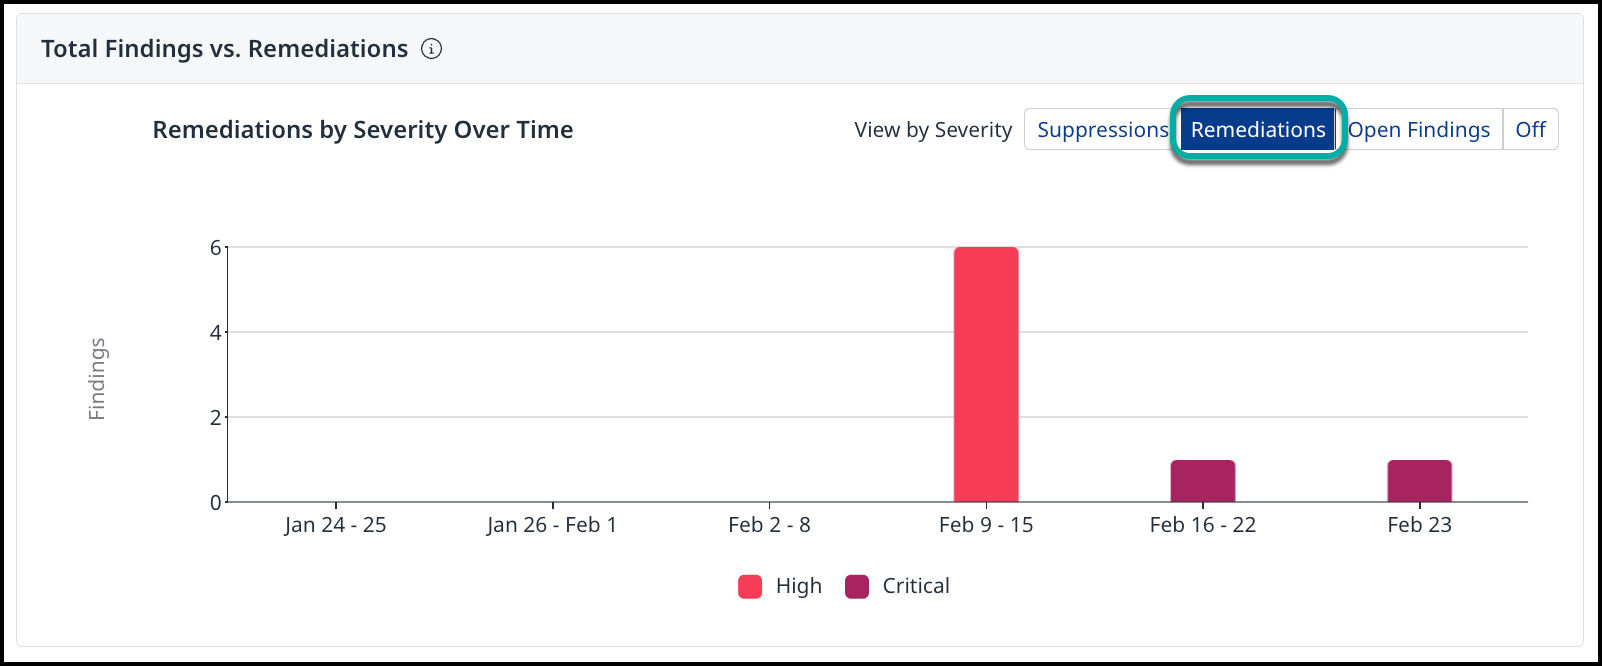
Remediations by Severity (Toggle = Remediations)
-
Open Findings by Severity (Toggle = Open Findings)
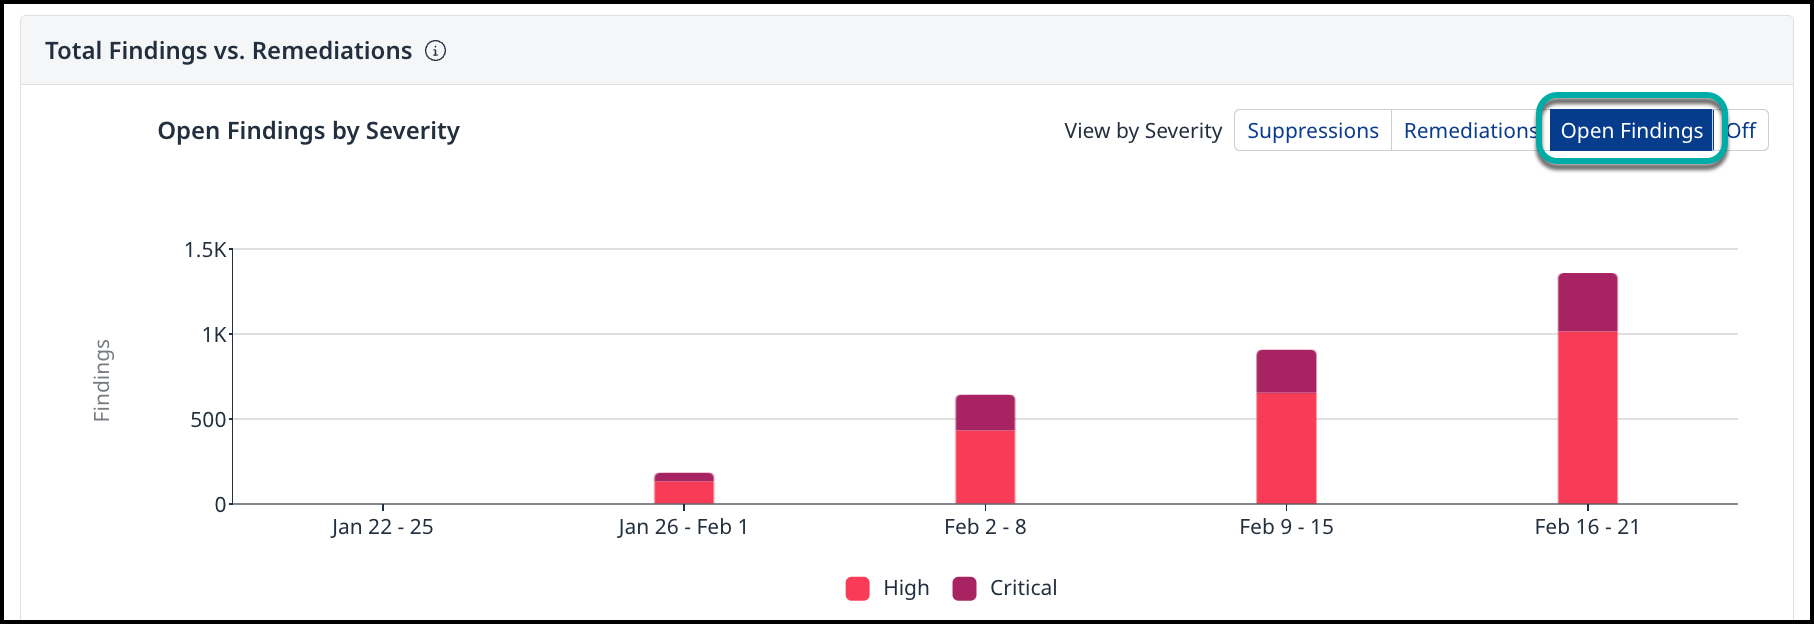
Tip: Hovering over each time period will display the number of findings that were remediated or suppressed, as well as the total number of open findings at that point in time, including both newly discovered and previously accumulated issues.
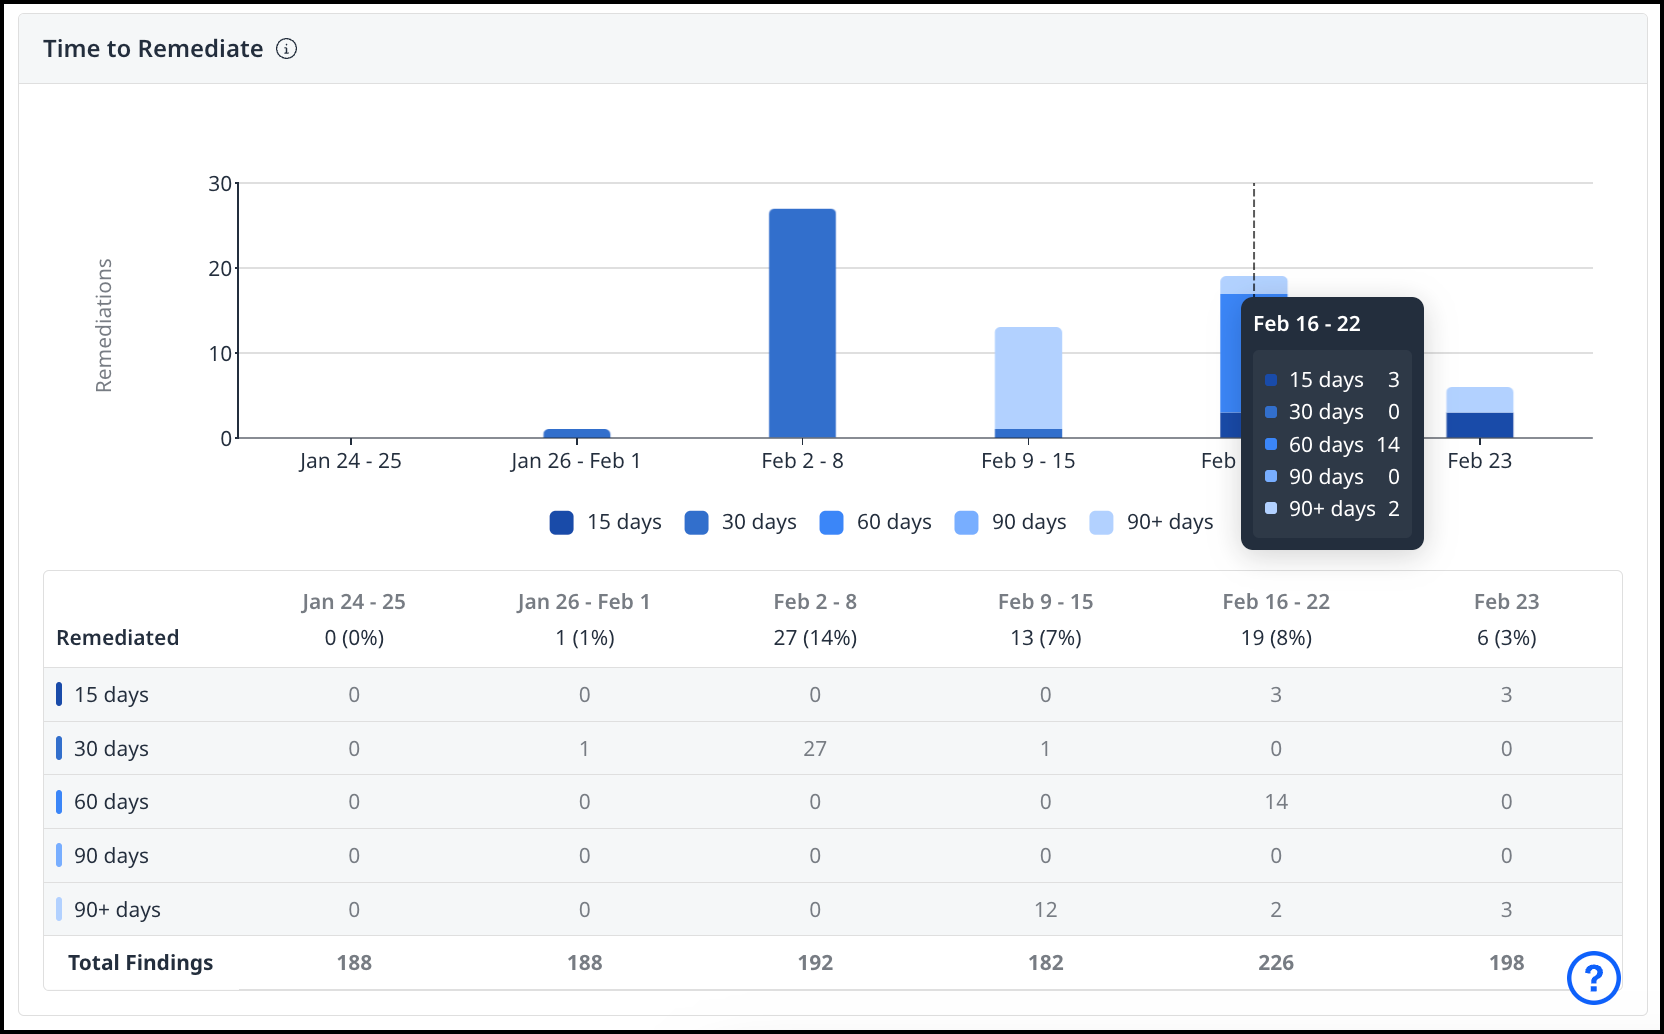
Time to Remediate
This widget displays the mean time taken to remediate findings over time, highlighting trends in remediation speed to evaluate security response efficiency and enabling comparison of remediation times across different periods to measure improvements.
Tip: To minimize security risks, we recommend remediating critical and high-severity findings within 15 to 30 days. If findings remain unaddressed beyond this timeframe, we suggest closely monitoring them to assess potential threats and prioritize remediation efforts effectively.
Exporting the Value Dashboard
To support reporting, collaboration, and record-keeping, the Value Dashboard includes the ability to export the entire dashboard view as a PDF file. This allows users to share insights, trends, and key performance indicators with stakeholders who may not have direct access to the Mend AppSec Platform.
How to Export to PDF:
-
Navigate to the Value Dashboard.
-
Click the Export as PDF icon (located in the top-right corner of the dashboard view).

-
A PDF file containing the current view of all widgets and applied filters will be generated and downloaded automatically.