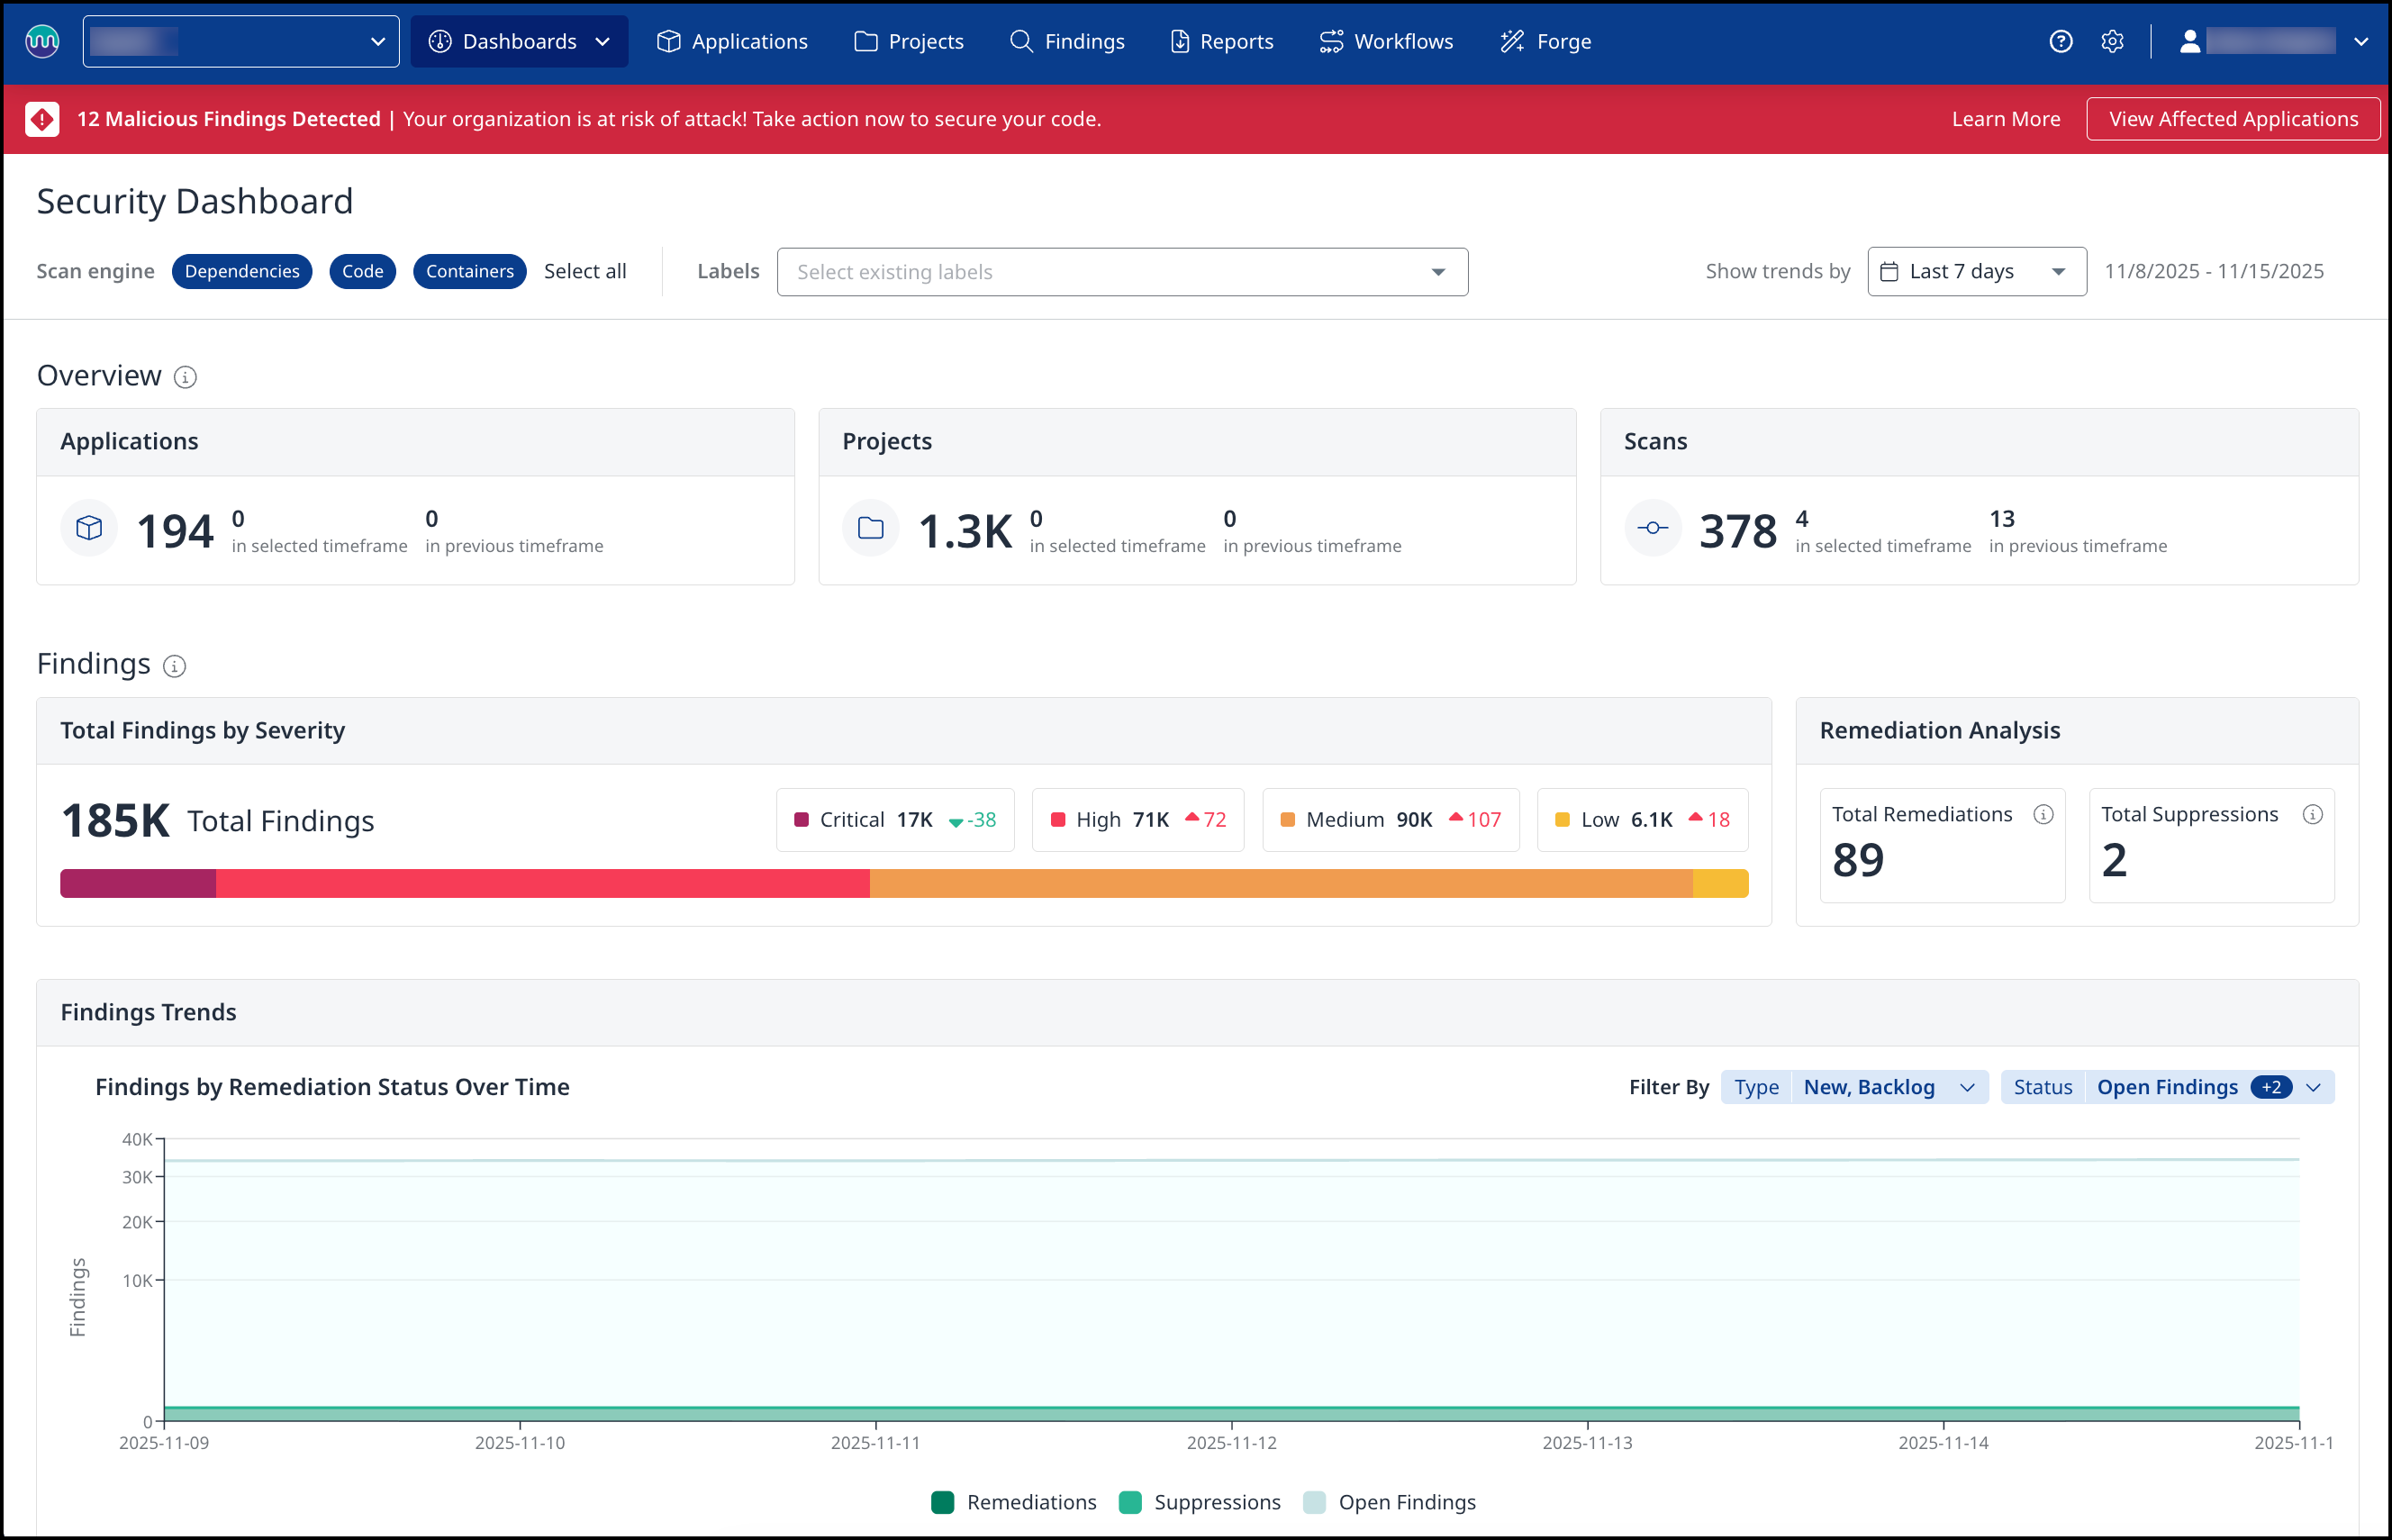
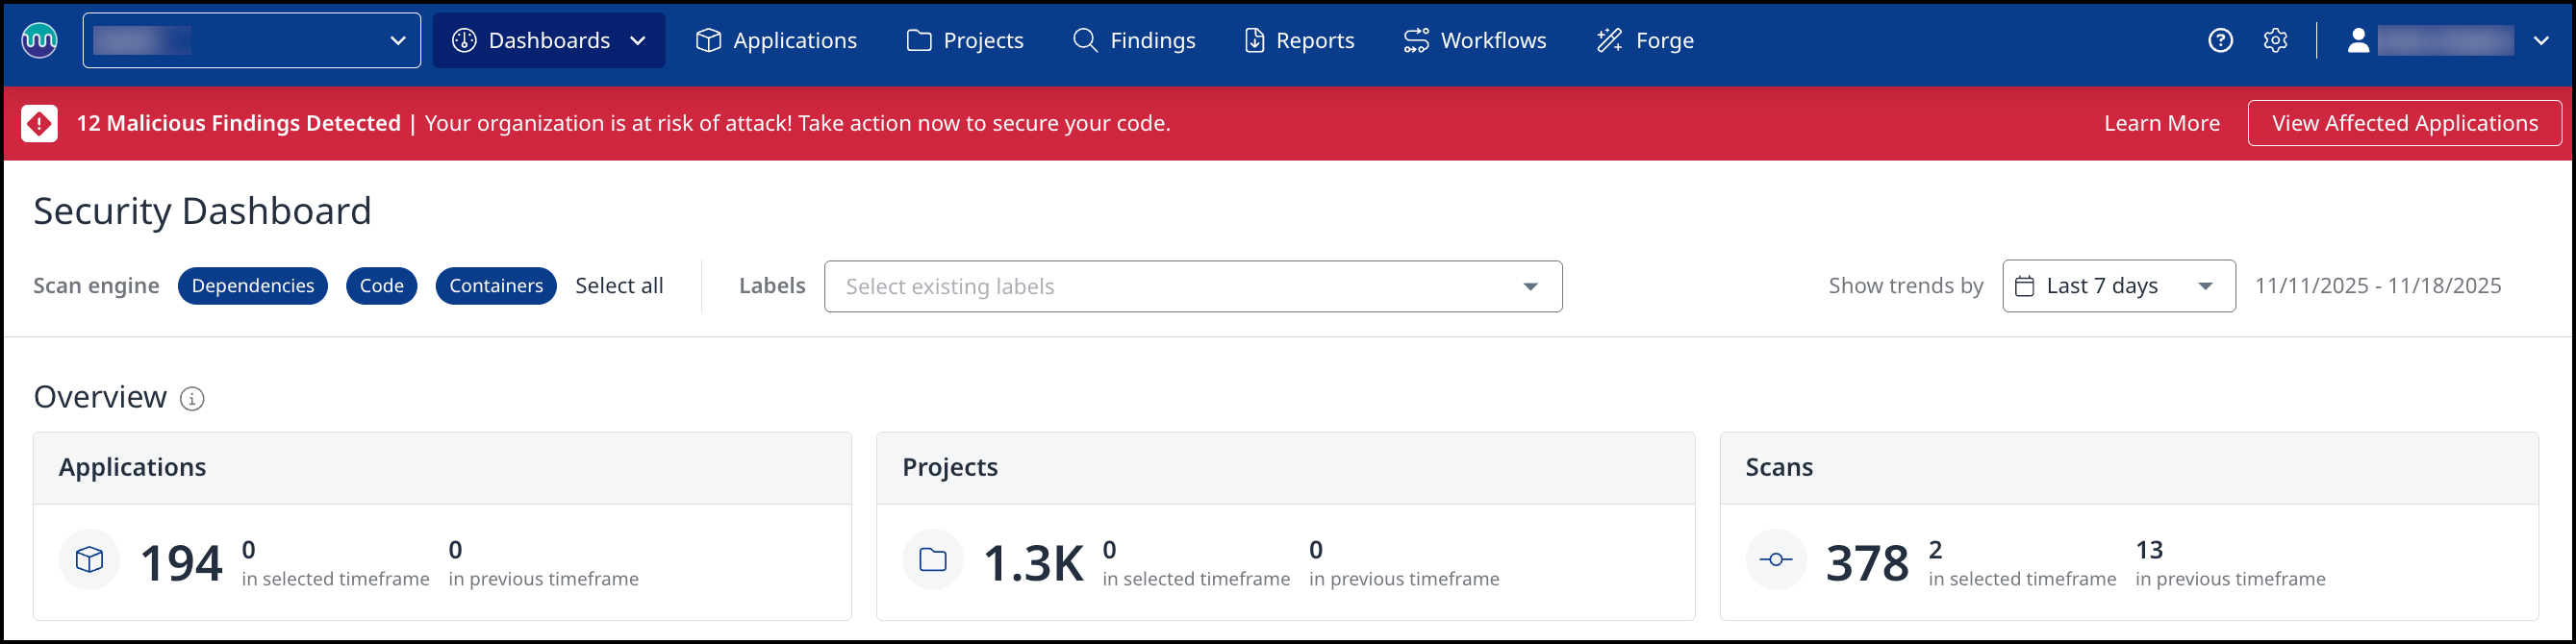
Overview
The Security Dashboard provides a high-level overview and analytics for SCA, SAST, and Containers scan findings across your entire Organization.
Getting it done
The Security Dashboard is divided into five sections. Data filtering is at the top, followed by the Overview, Findings, and Applications and Projects sections.
Data filtering
The data filtering section of the Security Dashboard offers three ways of refining the findings being displayed: by the Scan engine, by Labels, and by Trends. These filtering methods can be used individually or combined to drill down into the most granular results.
Scan engines
The findings from the different scan engines can be toggled on or off, allowing you to review them one at a time or all at once.
Note: The scan engine must be enabled for your organization by a Mend Admin before it can be used by you to display scan findings.
Labels
Labels can be used to refine the findings on the Security Dashboard to display only results for Applications and Projects with the listed Labels assigned.
Trends
Trends can be used to refine the findings displayed by all widgets on the Security Dashboard to only results within the past 7 days, 30 days, 90 days, 180 days, or within the Last year.

Overview
The Overview section comprises three widgets: Applications, Projects, Scans
-
The Applications widget shows the total number of Applications with Projects that have been scanned. This widget, if clicked, links to the Applications tab.
-
The Projects widget shows the total number of projects that have been scanned. This widget, if clicked, links to the Projects tab.
-
The Scans widget shows the total number of scans performed within the selected Trend window.
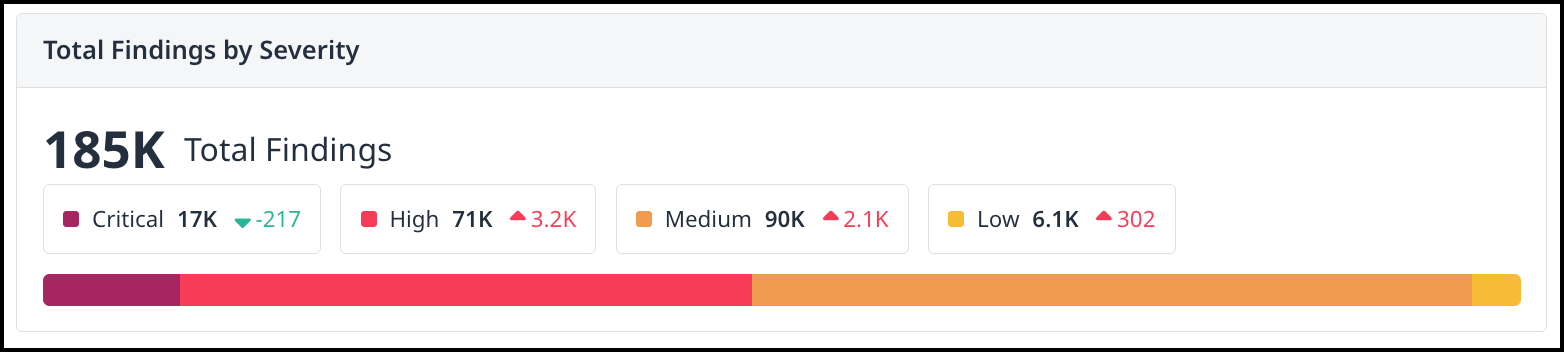
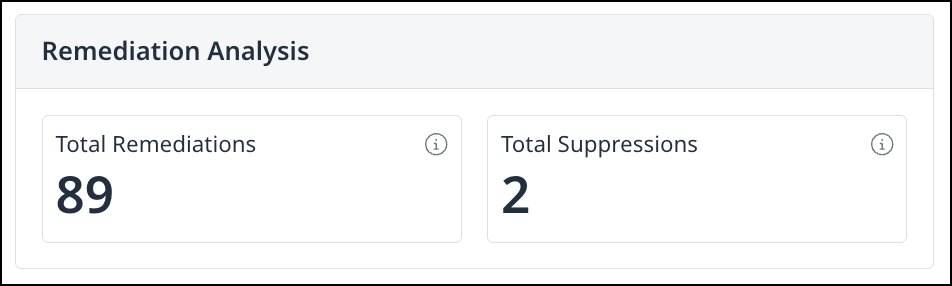
Findings
The Findings section comprises 3 widgets: Total Findings by Severity, Remediation Analysis, and Findings Trends.
-
The Total Findings by Severity widget displays the total number of findings within the Organization by severity level: Critical, High, Medium, or Low. Clicking on each severity will redirect you to the Applications view with all the applications that have at least one finding for the selected severity.
Hovering over a section of the graph reveals a breakdown of the findings by the scan engine.
-
The Remediation Analysis widget shows the total remediations for the selected date range and the total suppressions for the selected date range.
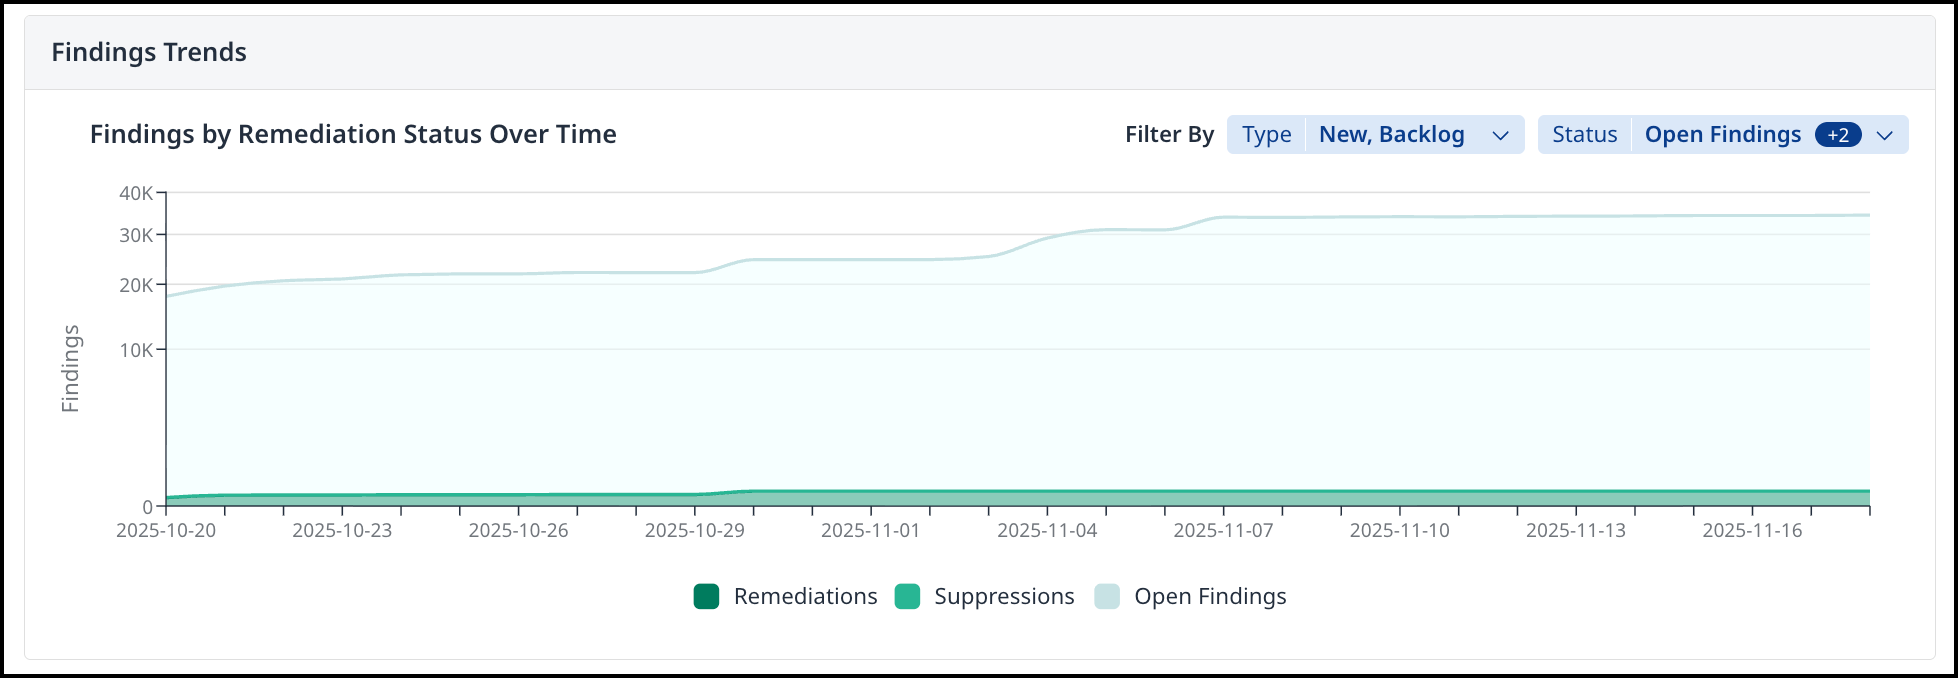
Findings Trends
The Findings Trends widget provides a time-based visualization of all security findings in your organization, grouped by their remediation status. This allows teams to understand how the volume of findings is evolving, how many have been addressed, and how many remain open.
The widget includes two filters that allow users to customize the data displayed:
-
Finding Type
-
Finding Status
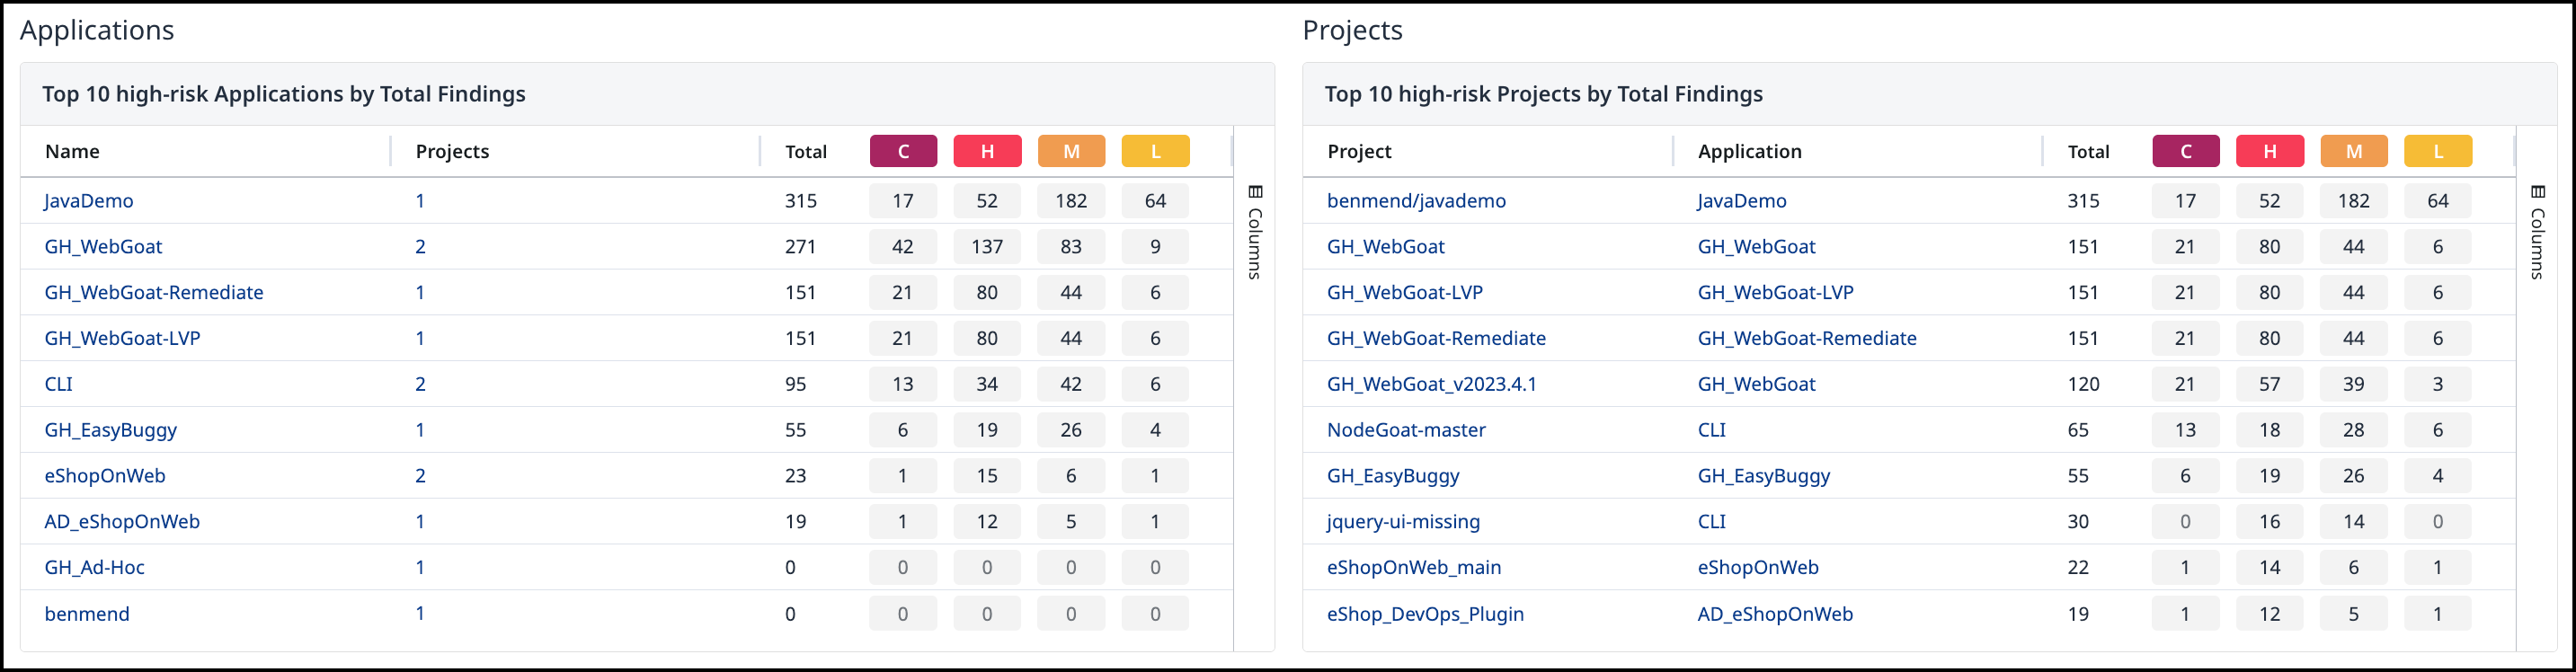
Applications and Projects
-
The Applications widget shows the Top 10 High-risk applications by either total findings or policy violations. By default, the widget shows the top 10 applications ordered by the highest total findings. The top 10 applications can also be ranked by most Critical, High, Medium, or Low findings by clicking the C, H, M, and L headers.
-
The Products widget shows the Top 10 High-risk projects by either total findings or policy violations. By default, the widget shows the top 10 projects ordered by the highest total findings. The top 10 projects can also be ranked by most Critical, High, Medium, or Low findings by clicking the C, H, M, and L headers.
Reference
Application widget table values
|
Name |
Description |
|---|---|
|
Name |
The Applications Name |
|
Projects |
The number of projects within the Application |
|
Total |
The total number of findings within the Application |
|
Critical (C) |
The total number critical of findings within the Application |
|
High (H) |
The total number high of findings within the Application |
|
Medium (M) |
The total number medium of findings within the Application |
|
Low (L) |
The total number low of findings within the Application |
Project widget table values
|
Name |
Description |
|---|---|
|
Name |
The Projects Name |
|
Application |
The Application the Project is assigned to |
|
Total |
The total number of findings within the Project |
|
Critical (C) |
The total number critical of findings within the Project |
|
High (H) |
The total number high of findings within the Project |
|
Medium (M) |
The total number medium of findings within the Project |
|
Low (L) |
The total number low of findings within the Project |