Analytics Tab
Note: The legacy Mend SAST application was deprecated on April 1st, 2025. For assistance with migrating to the Mend AppSec Platform, please contact your customer success manager or the success team at success@mend.io.
Overview
The Analytics tab provides a dashboard with an organization-wide overview:
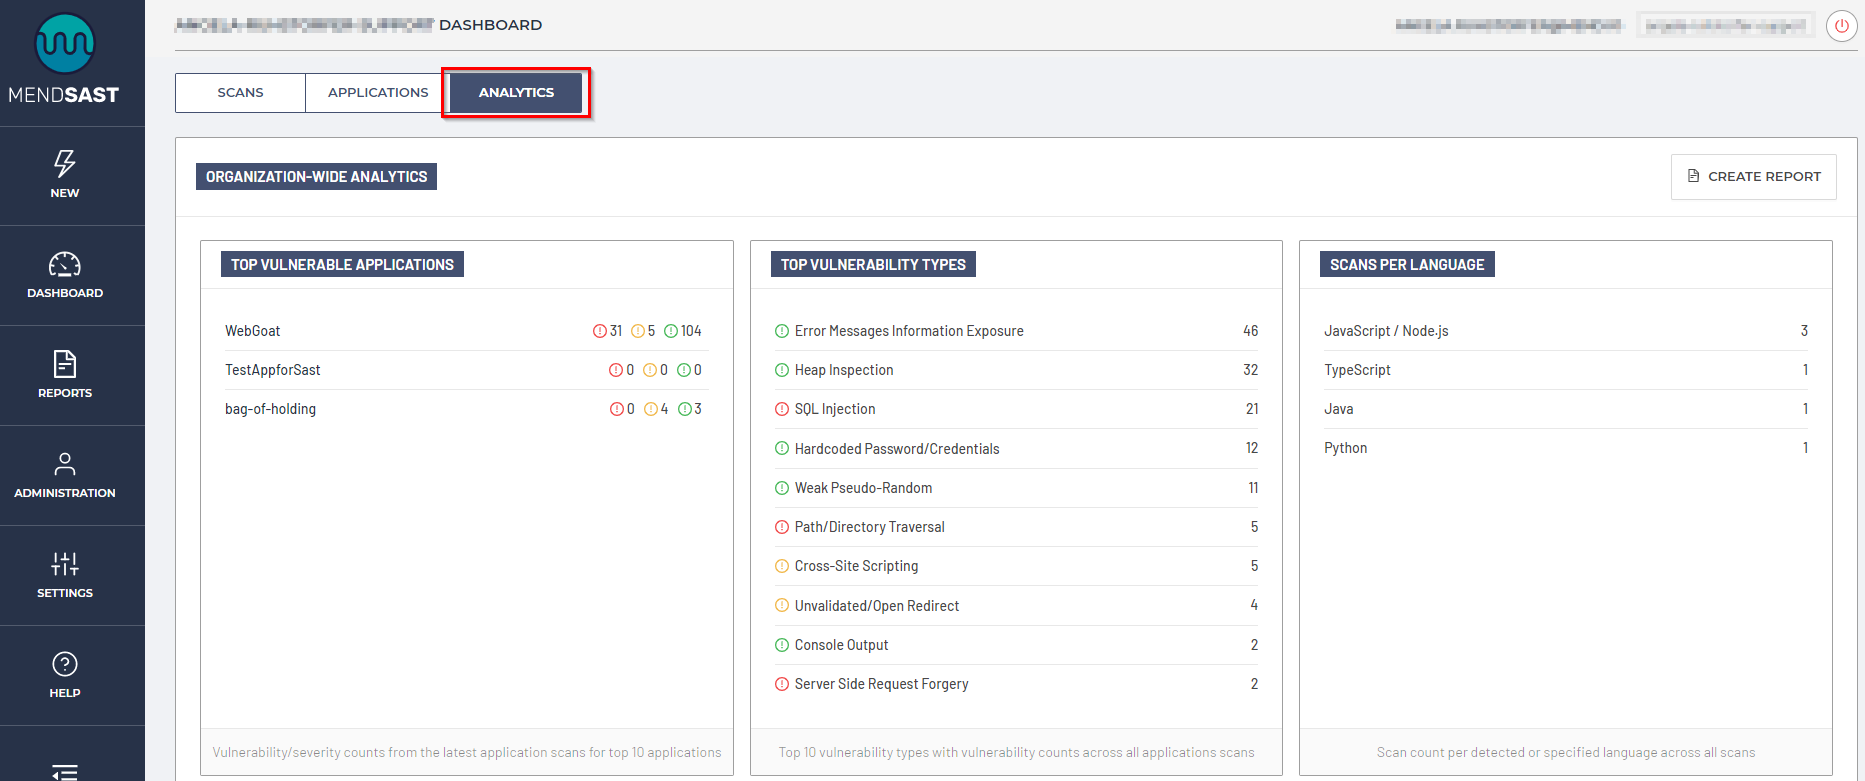
In each analytics card, you can view the counts, risks, remediation progress, and compliance standard violations across all organization applications.
Cards
KPI
The KPI card displays the most recent number of Applications scanned, the total number of findings, and their trends over time:

Top Vulnerable Applications
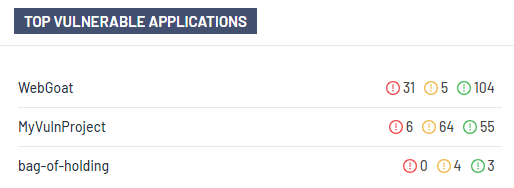
The top vulnerable applications card displays the vulnerability/severity counts from the latest application scans for the top 10 applications in your organization:
Top Vulnerability Types
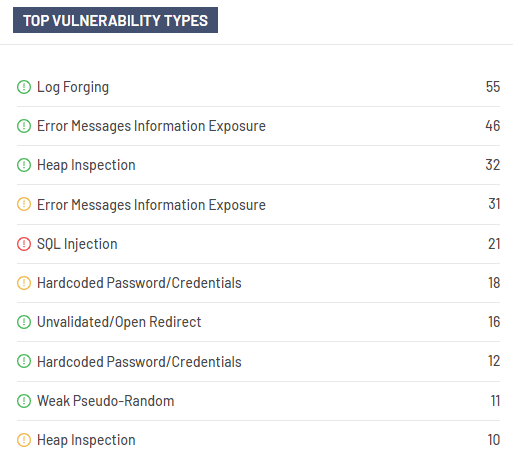
The top vulnerability types card displays the top 10 vulnerability types with vulnerability counts across all applications scans in your organization:
Scans Per Language
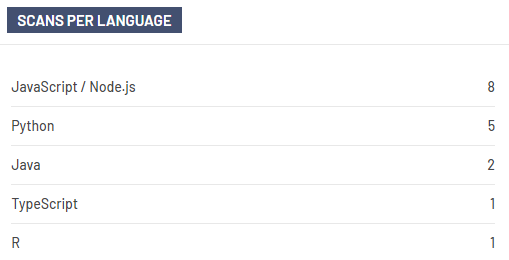
The scans per language card displays the scan count per detected or specified language(s) across all application scans in your organization:
Remediation Progress
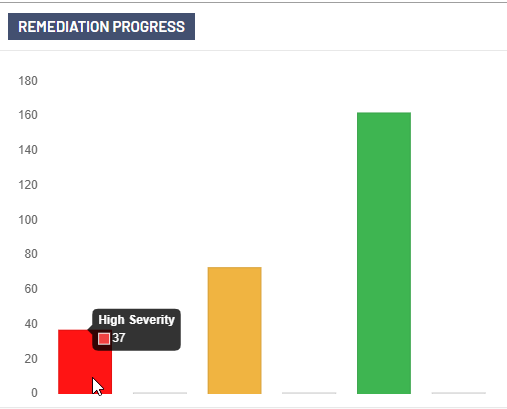
The remediation progress card displays the comparison between vulnerability severity counts discovered in your application baseline scans and the latest scans. Hovering over the bar chart will display the vulnerability severity level and count:
OWASP Top 10 2017
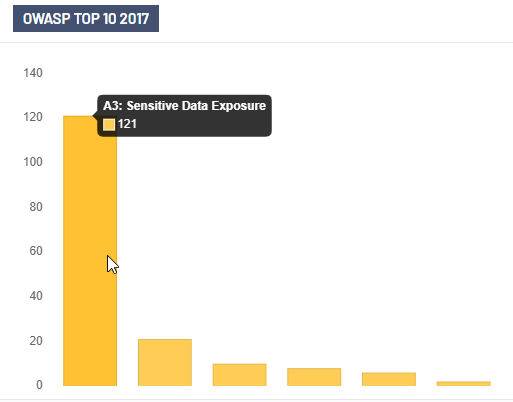
The OWASP top 10 2017 card displays the “OWASP Top 10 2017” violations with vulnerability counts from the latest application scans. Hovering over each bar within the graph will show you the ID, ID Description, and total count within your organization:
OWASP Top 10 2021
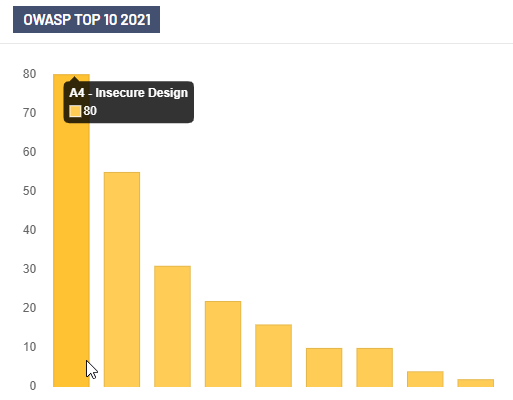
The OWASP top 10 2021 card displays the “OWASP Top 10 2021 ” violations with vulnerability counts from the latest application scans. Hovering over each bar within the graph will show you the ID, ID Description, and total count within your organization:
NIST
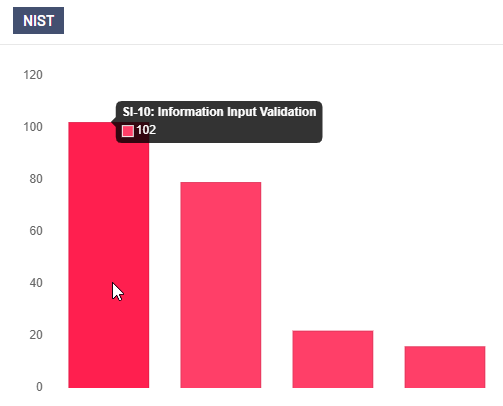
The NIST card displays the “NIST” violations with vulnerability counts from the latest application scans. Hovering over each bar within the graph will show you the ID, ID Description, and total count within your organization:
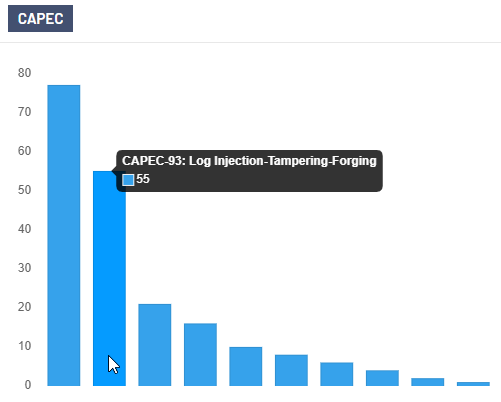
CAPEC
The CAPEC card displays the “CAPEC” violations with vulnerability counts from the latest application scans. Hovering over each bar within the graph will show you the ID, ID Description, and total count within your organization:
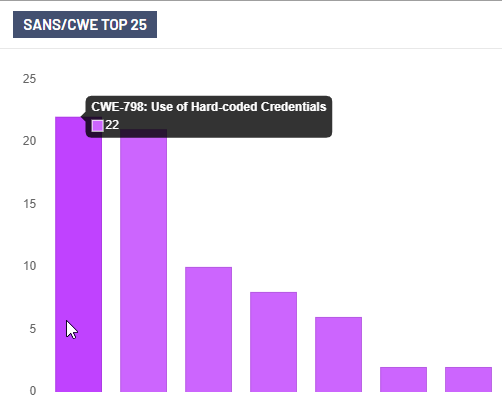
SANS/CWE TOP 25
The SANS/CWE top 25 card displays the “SANS/CWE TOP 25” violations with vulnerability counts from the latest application scans. Hovering over each bar within the graph will show you the ID, ID Description, and total count within your organization:
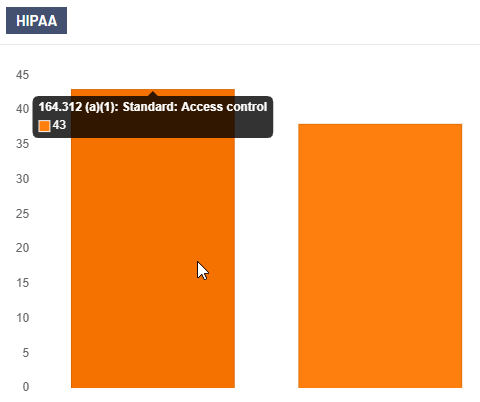
HIPAA
The HIPAA card displays the “HIPAA” violations with vulnerability counts from the latest application scans. Hovering over each bar within the graph will show you the ID, ID Description, and total count within your organization:
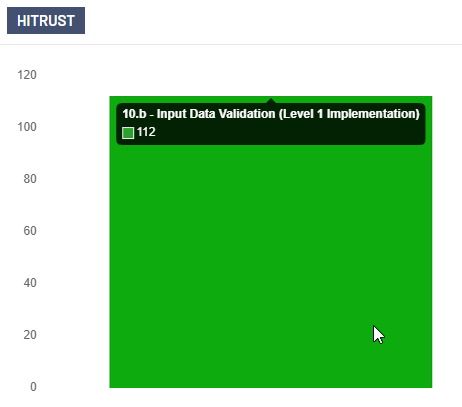
HITRUST
The HITRUST card displays the “HITRUST” violations with vulnerability counts from the latest application scans. Hovering over each bar within the graph will show you the ID, ID Description, and total count within your organization:
PCI DSS
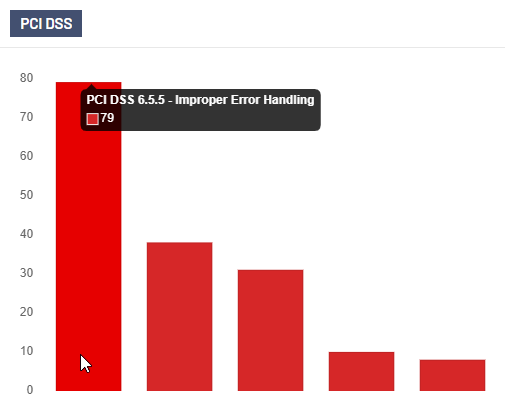
The PCI DSS card displays the “PCI DSS” violations with vulnerability counts from the latest application scans. Hovering over each bar within the graph will show you the ID, ID Description, and total count within your organization:
Creating an analytics report
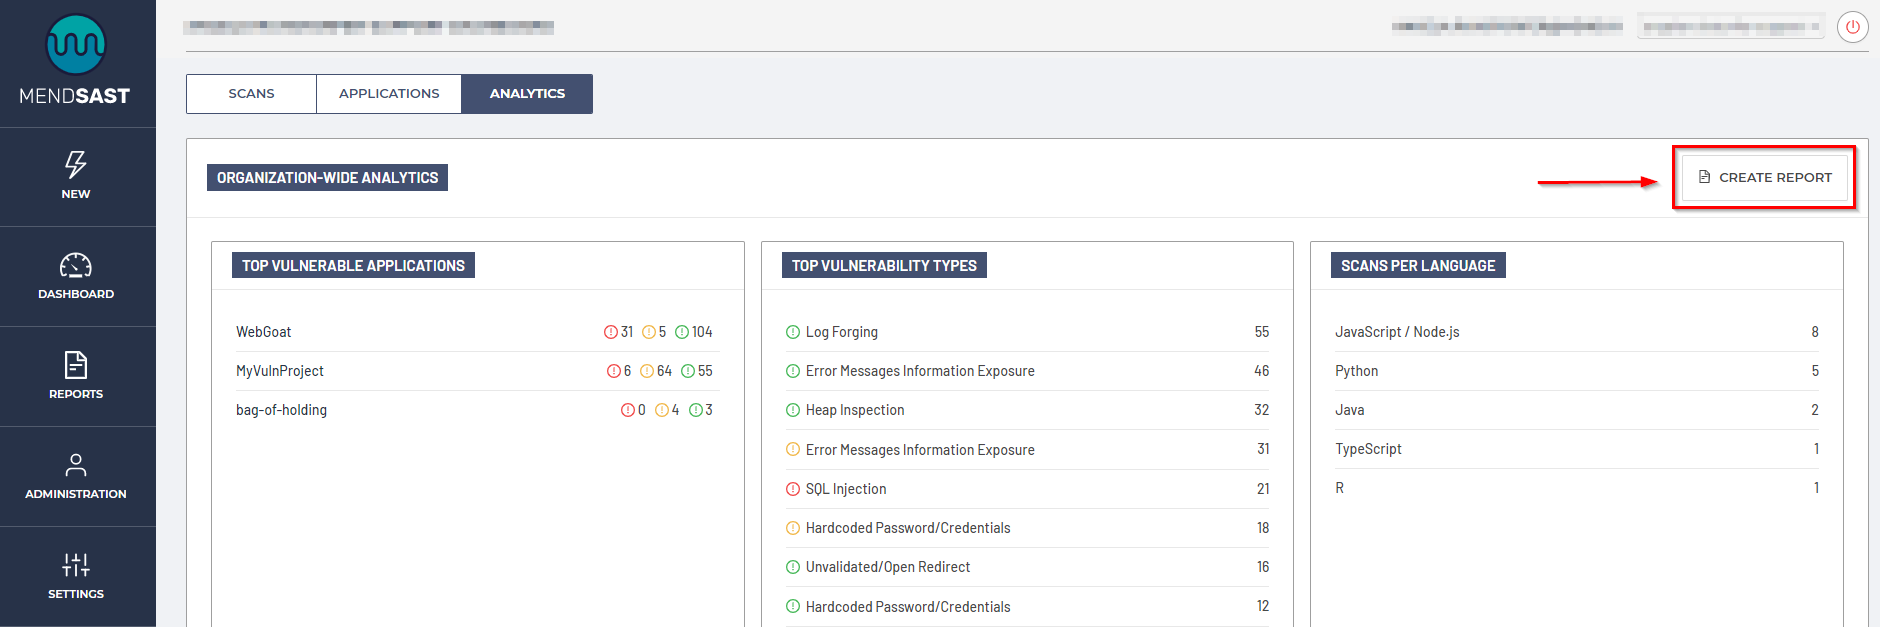
You can create an analytics report by clicking on the Create Report option in the top-right corner of the UI within the Analytics tab:
Report Configuration
Report Parameter | Definition |
|---|---|
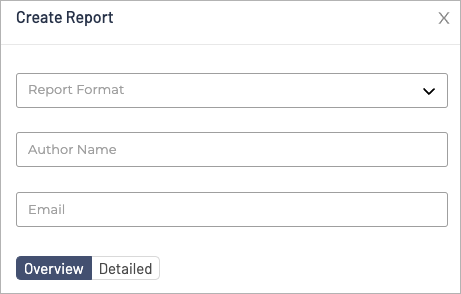
Report Format | The file format for the report. Our options include:
|
Author Name | The name of the author you wish to have displayed in the report |
The email address(es) you wish to have displayed in the report | |
Overview vs Detailed |
|
